| East Bay Area September Yearly Trends | |||
|---|---|---|---|
| Alameda, Contra Costa, Solano | |||
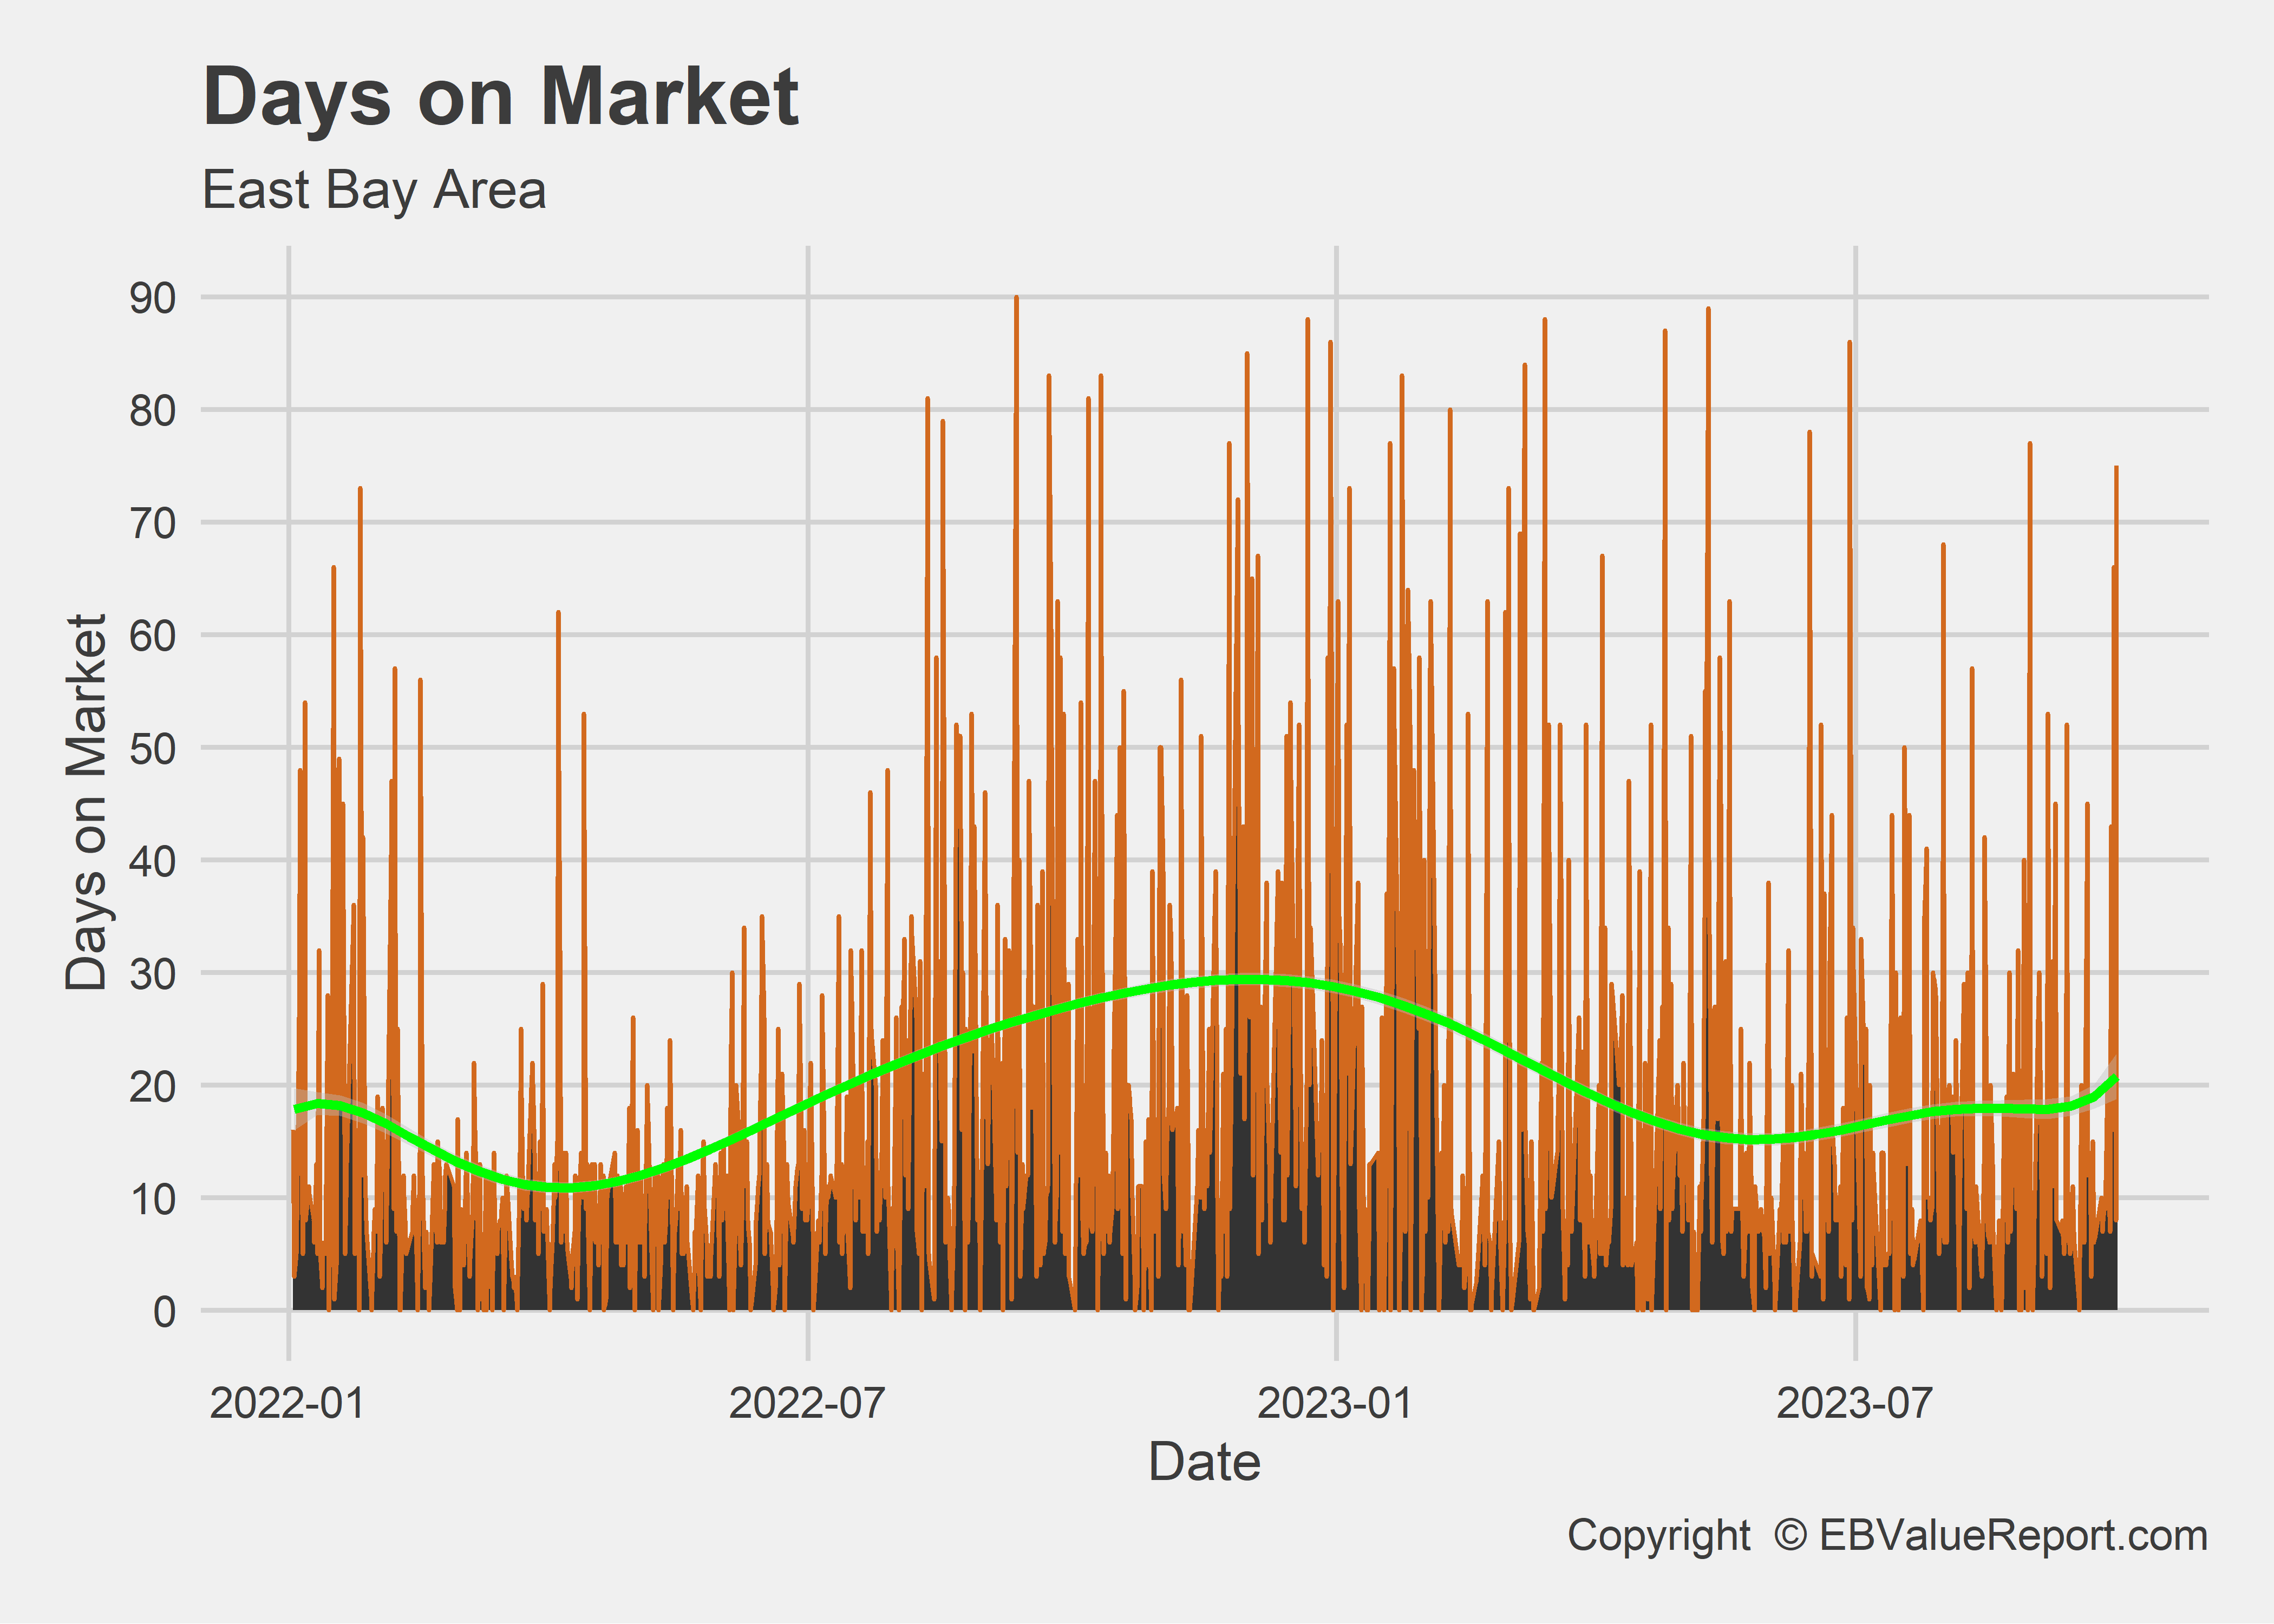
| 2022 | 2023 | % Change | |
| Median Price | 910250 | 945000 | 3.8% |
| Average Price per SF | 596 | 624 | 4.7% |
| Number of Sales | 1948 | 1433 | -26.4% |
| Median DOM | 21 | 12 | -42.9% |
| Copyright © EBValueReport.com | |||
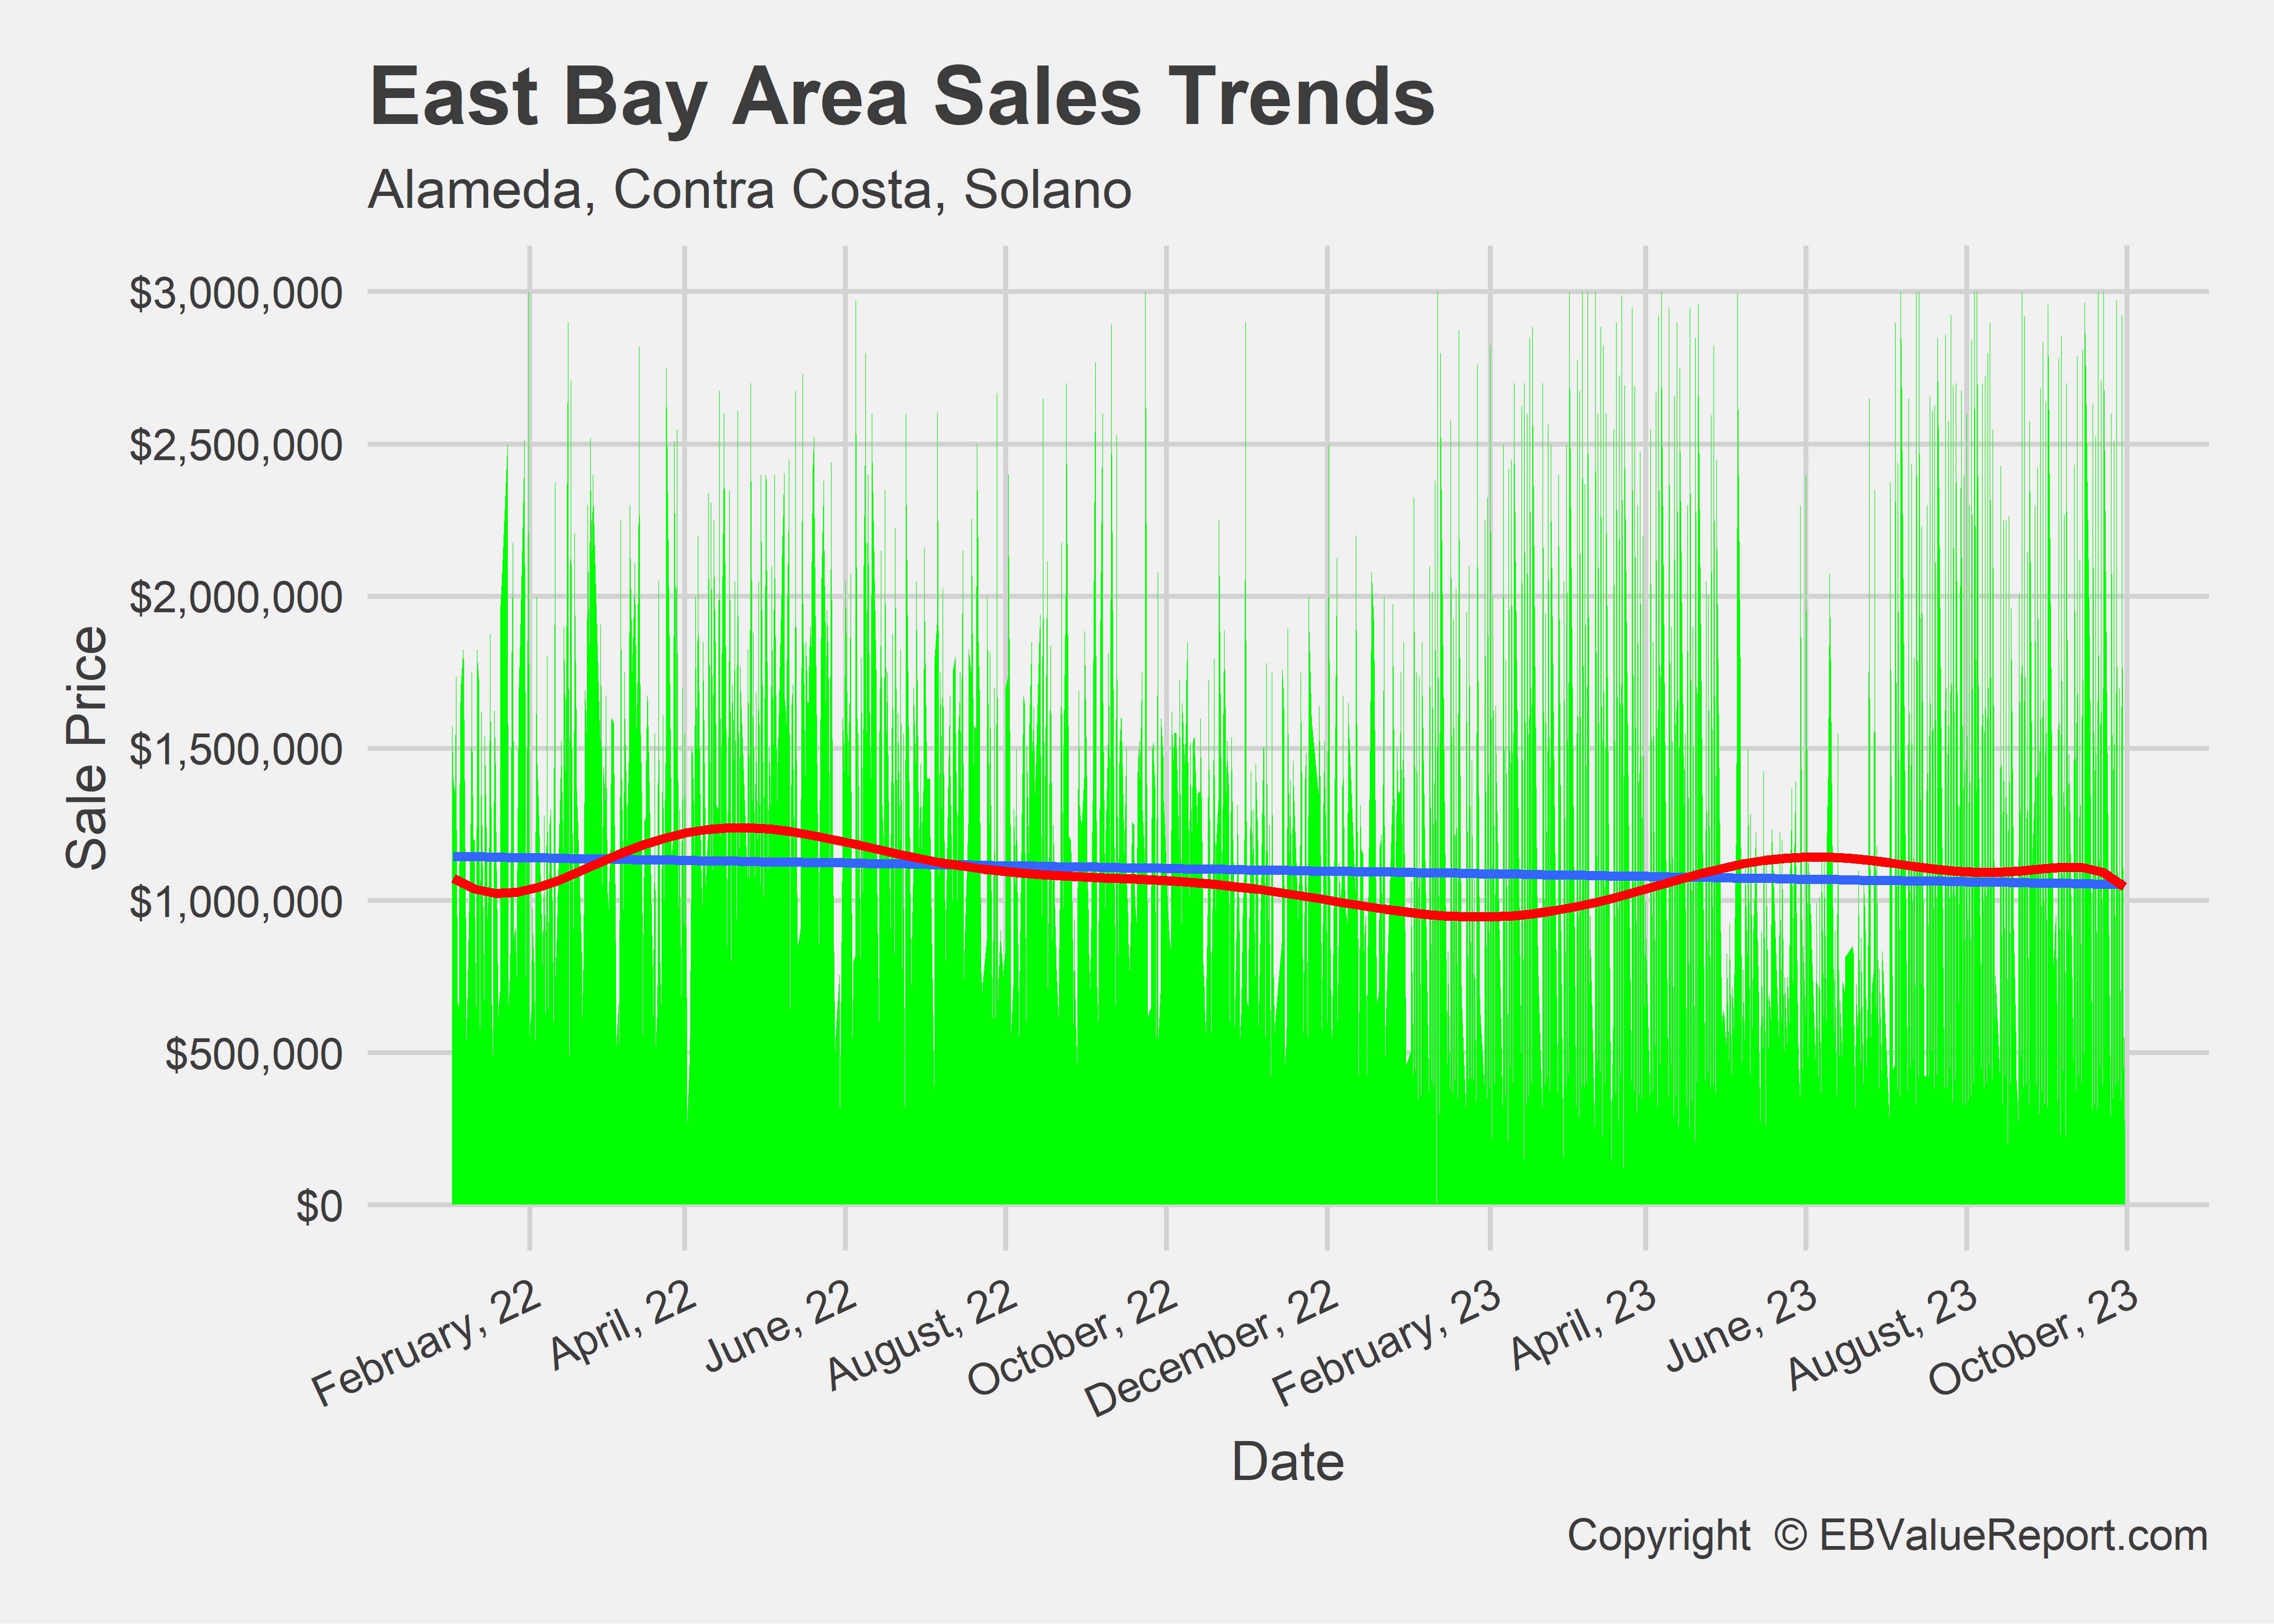
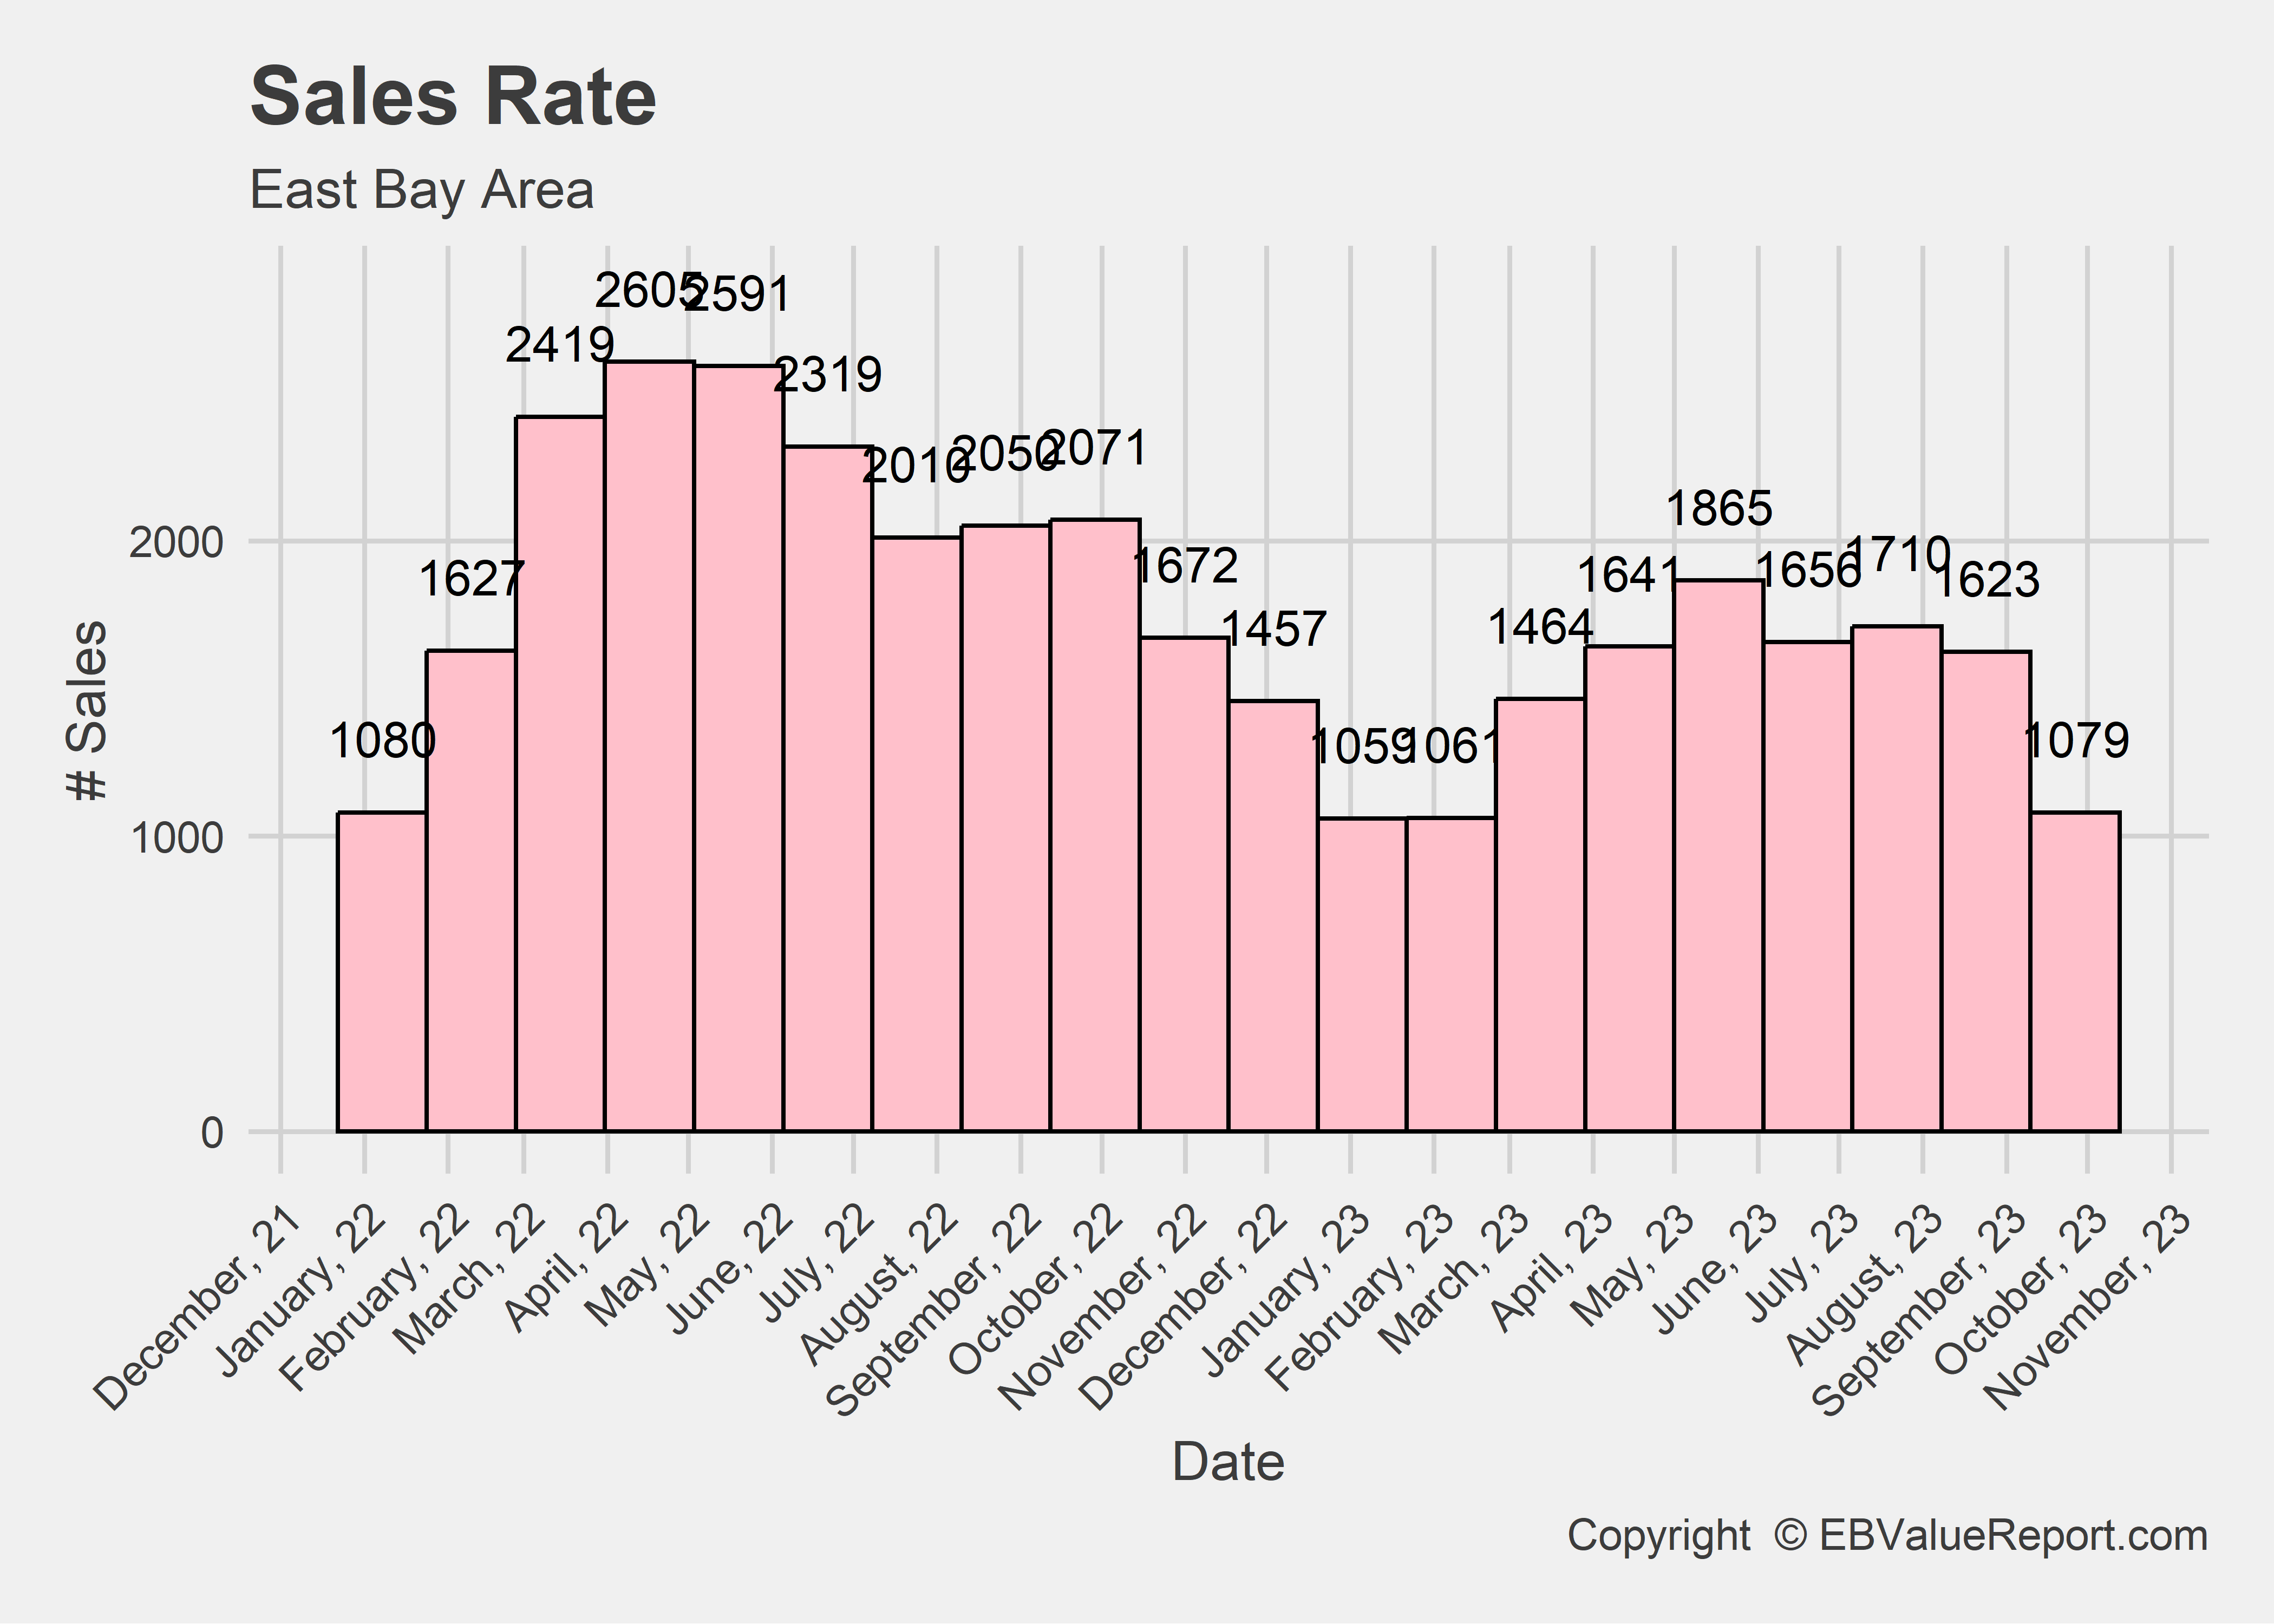
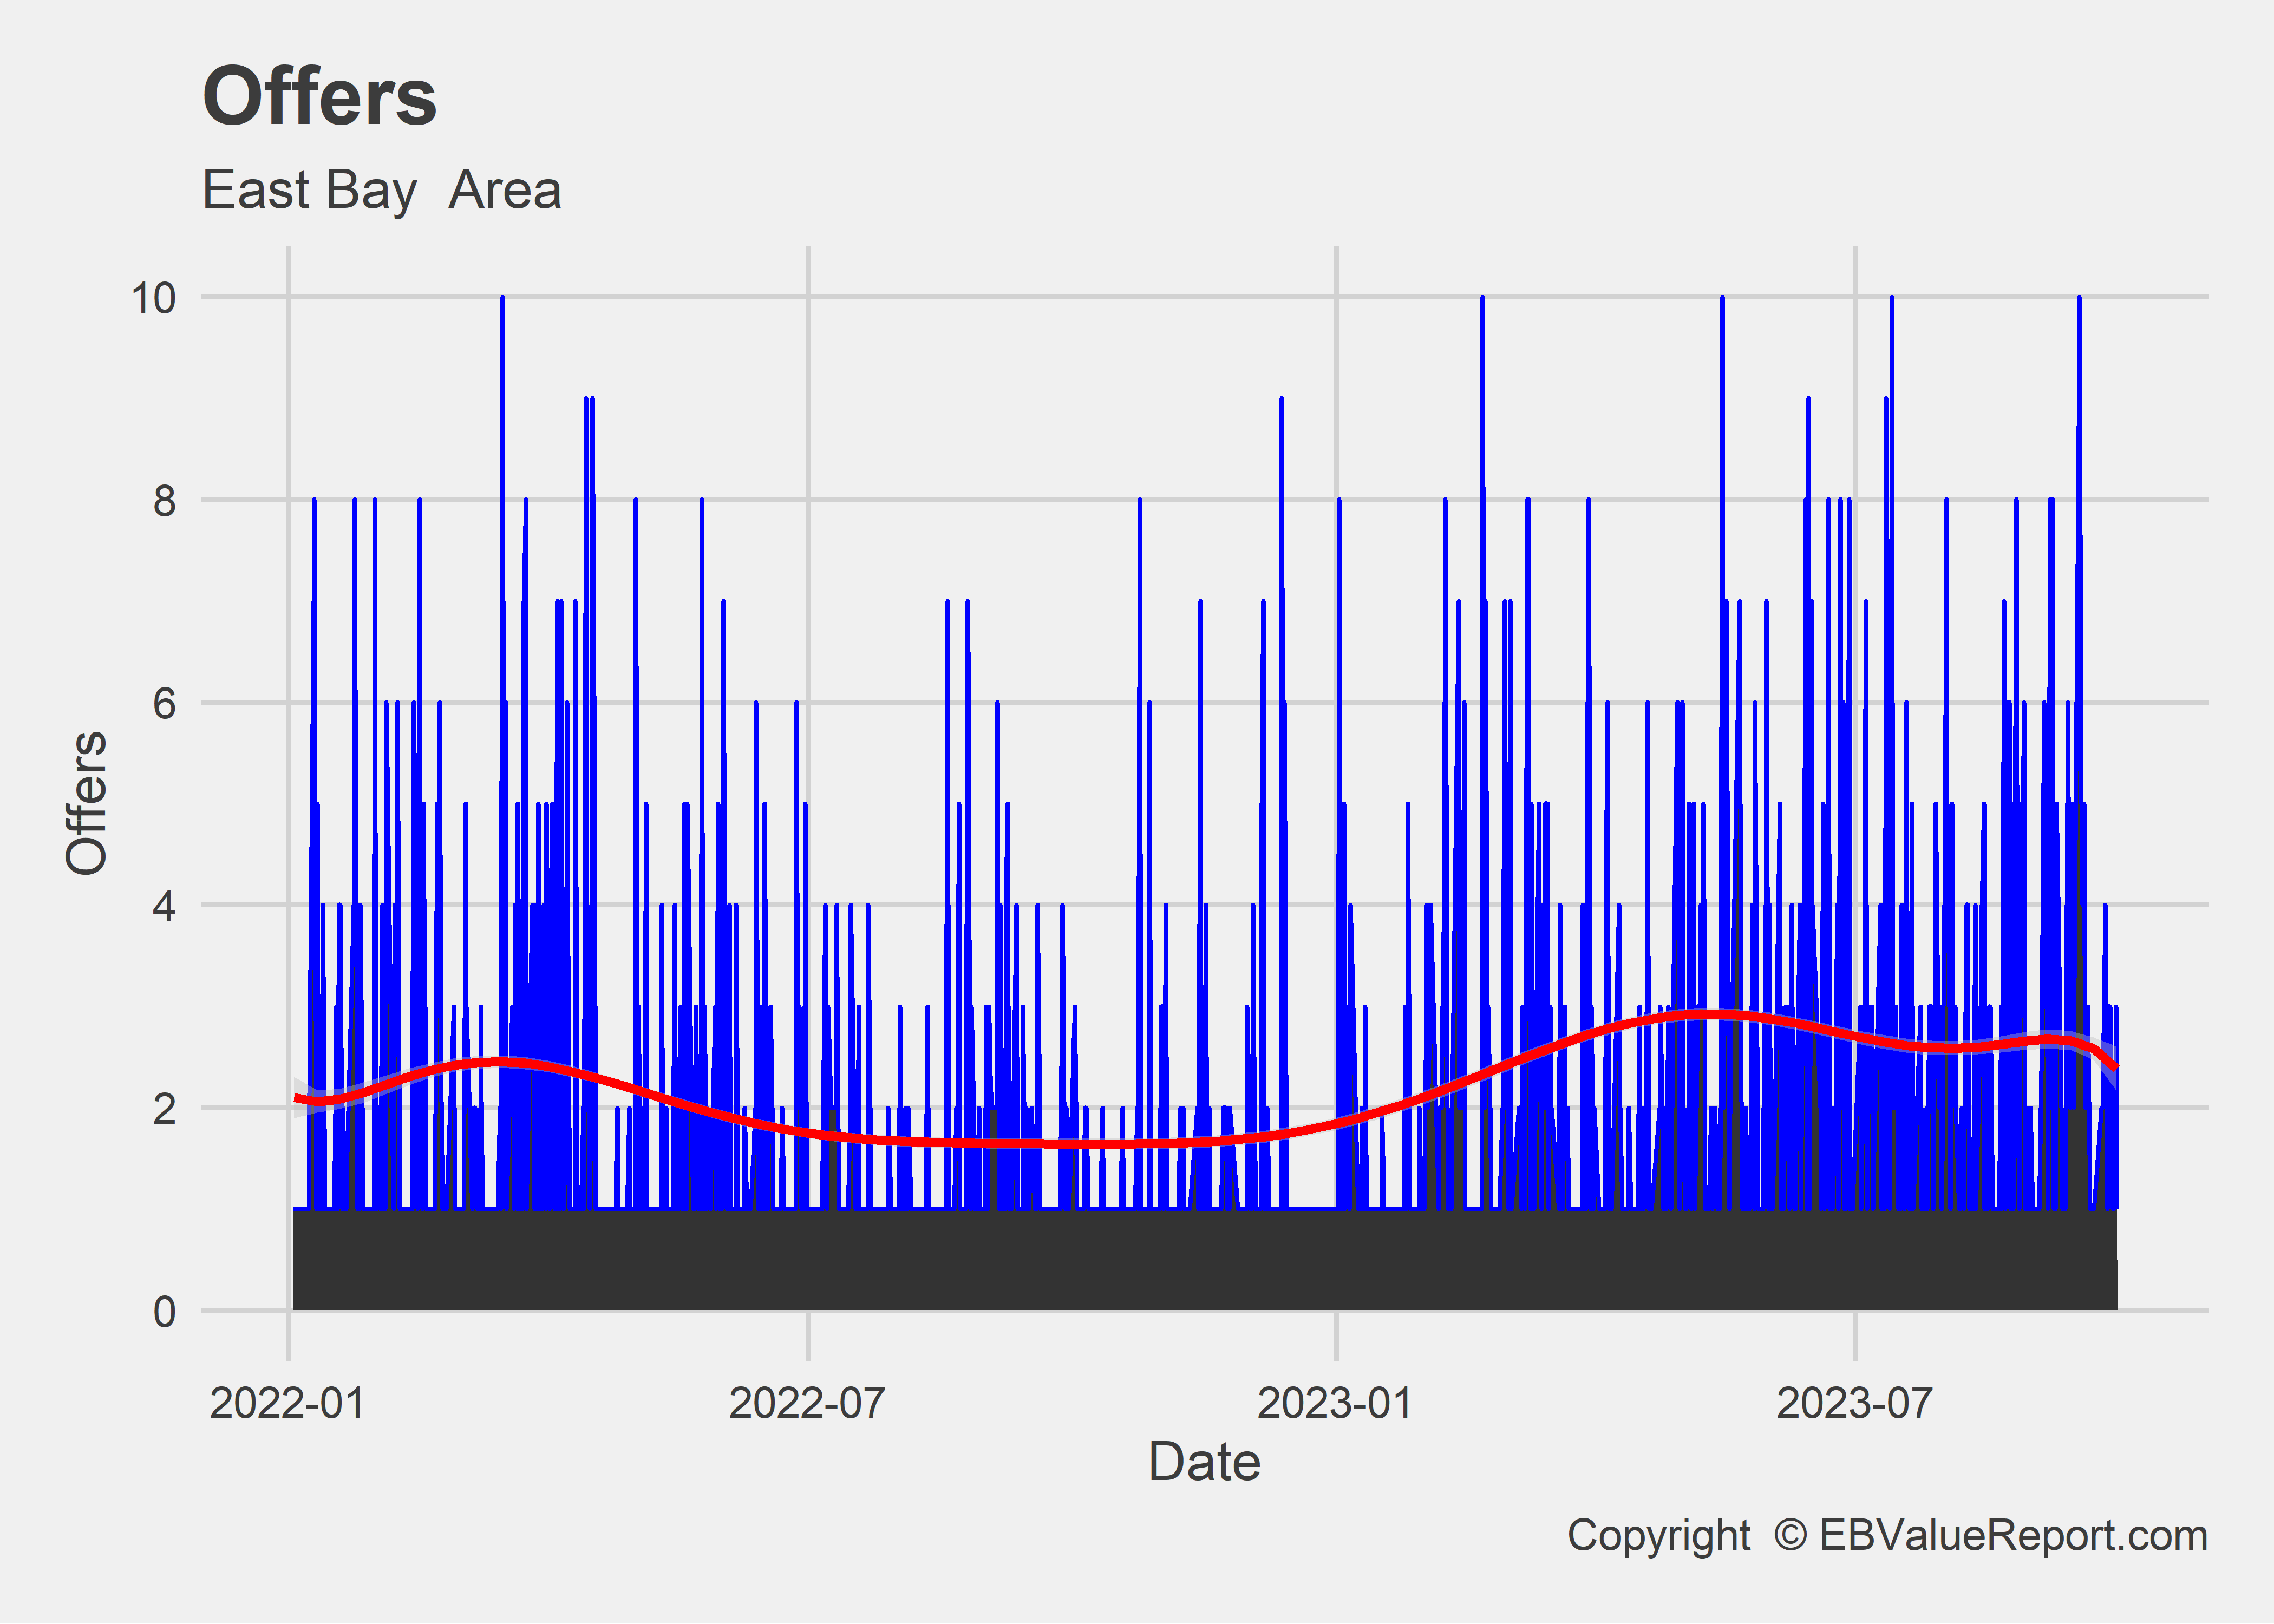
Halloween is nearly here and with cratering listing volume. September had less sales than the prior December and 1/2 the sales of last September 2022. Prices didn’t quite reach last years high but prices are higher than they were last fall. This was due to the rapid price declines we saw in Q4 2022.
Mortgage and Me
This section is the summary of the ongoing sitcom, “Mortgage and Me”, where you get news of what the banks are doing and how it affects us all.
Mortgage Rates: Higher than Snoop Dog in 1994
Yikes. The rates are just awful right now. We will see what the FED says in their remaining meetings. The Federal Reserve Board have two more meeting this year that will decide how the winter/spring markets will unfold.
Refinance Volume: Reverse Mortgages and HELOCs
Without surprise, refinance volume has dipped with more rate hikes. HELOCs are exploding and I am seeing more Reverse Mortgages coming across my desk as older folks see less value in selling due to rates.
East Bay Area Market Update
Normally, sales volume declines from now through the rest of the year. Most markets still show appreciation though that will change as soon as we get closer to the holidays. With only about 1000 sales in September in the three counties, where will we be in December/January. 500? Less?
Alameda Trends
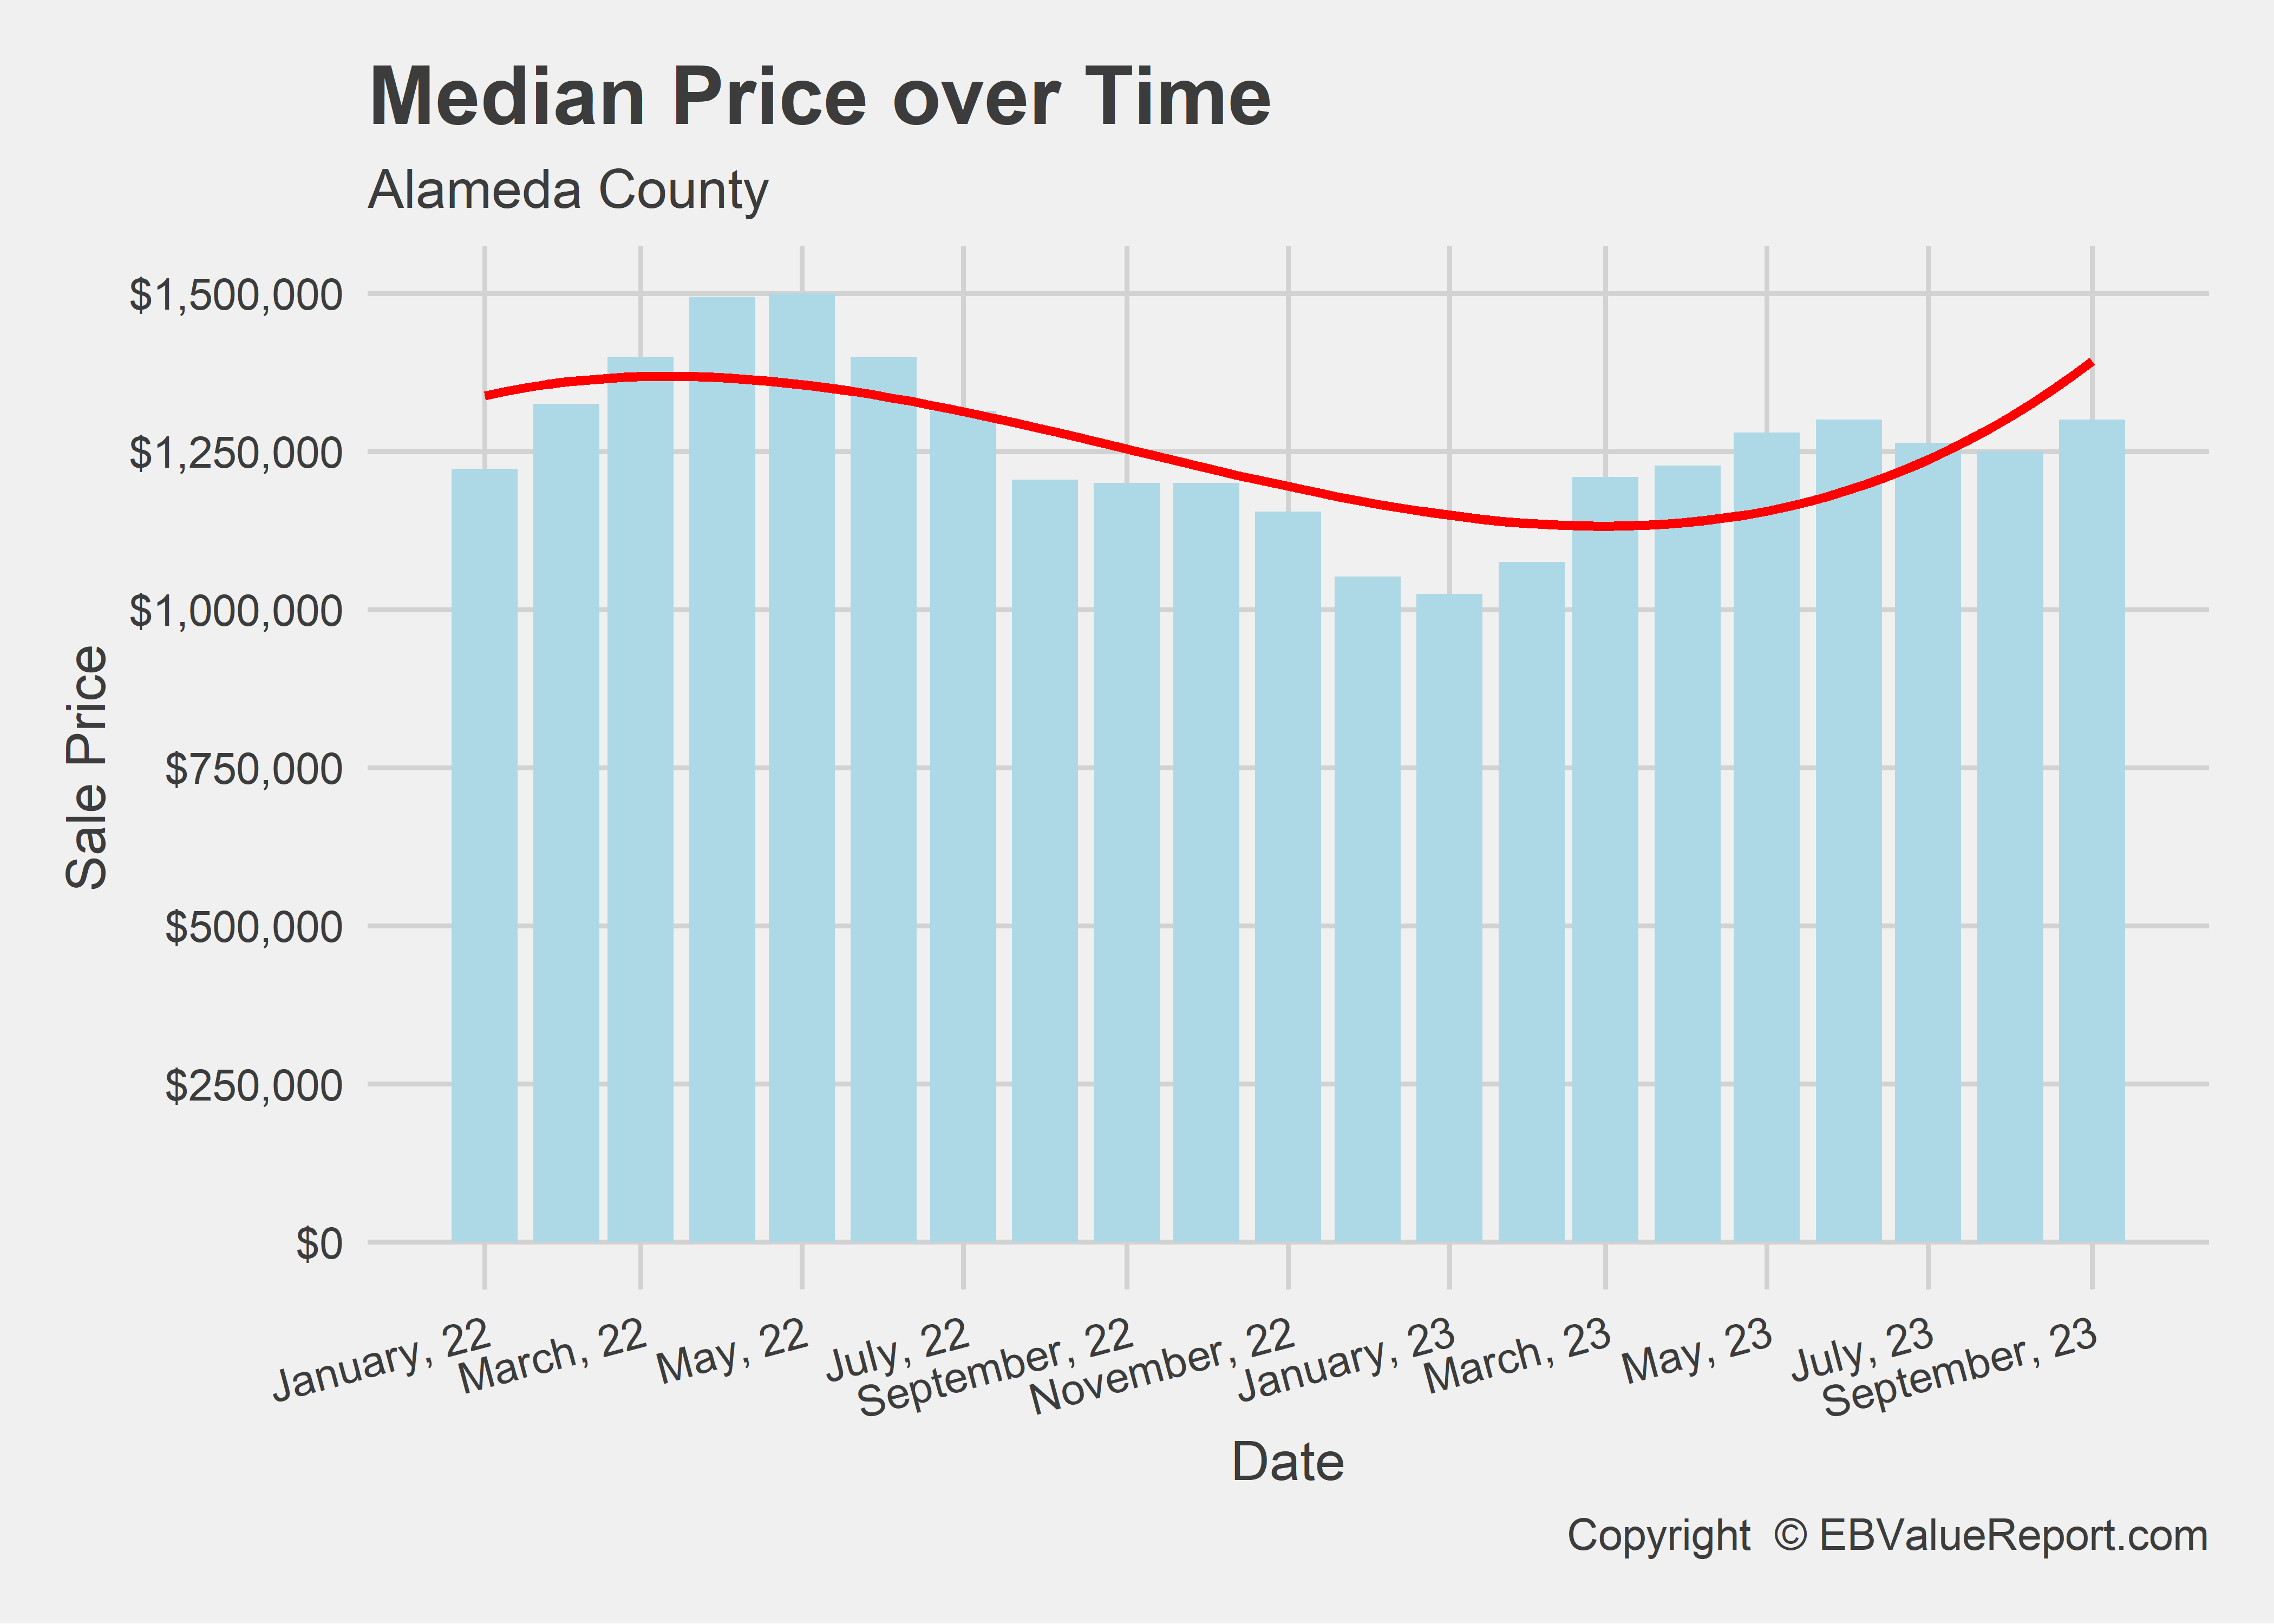
| Alameda County Housing Trends | |||
|---|---|---|---|
| Detached Single Family Homes | |||
| Aug 2023 | Sep 2023 | % Change | |
| Median Price | 1250000 | 1300000 | 4.0% |
| Average Price per SF | 751 | 786 | 4.7% |
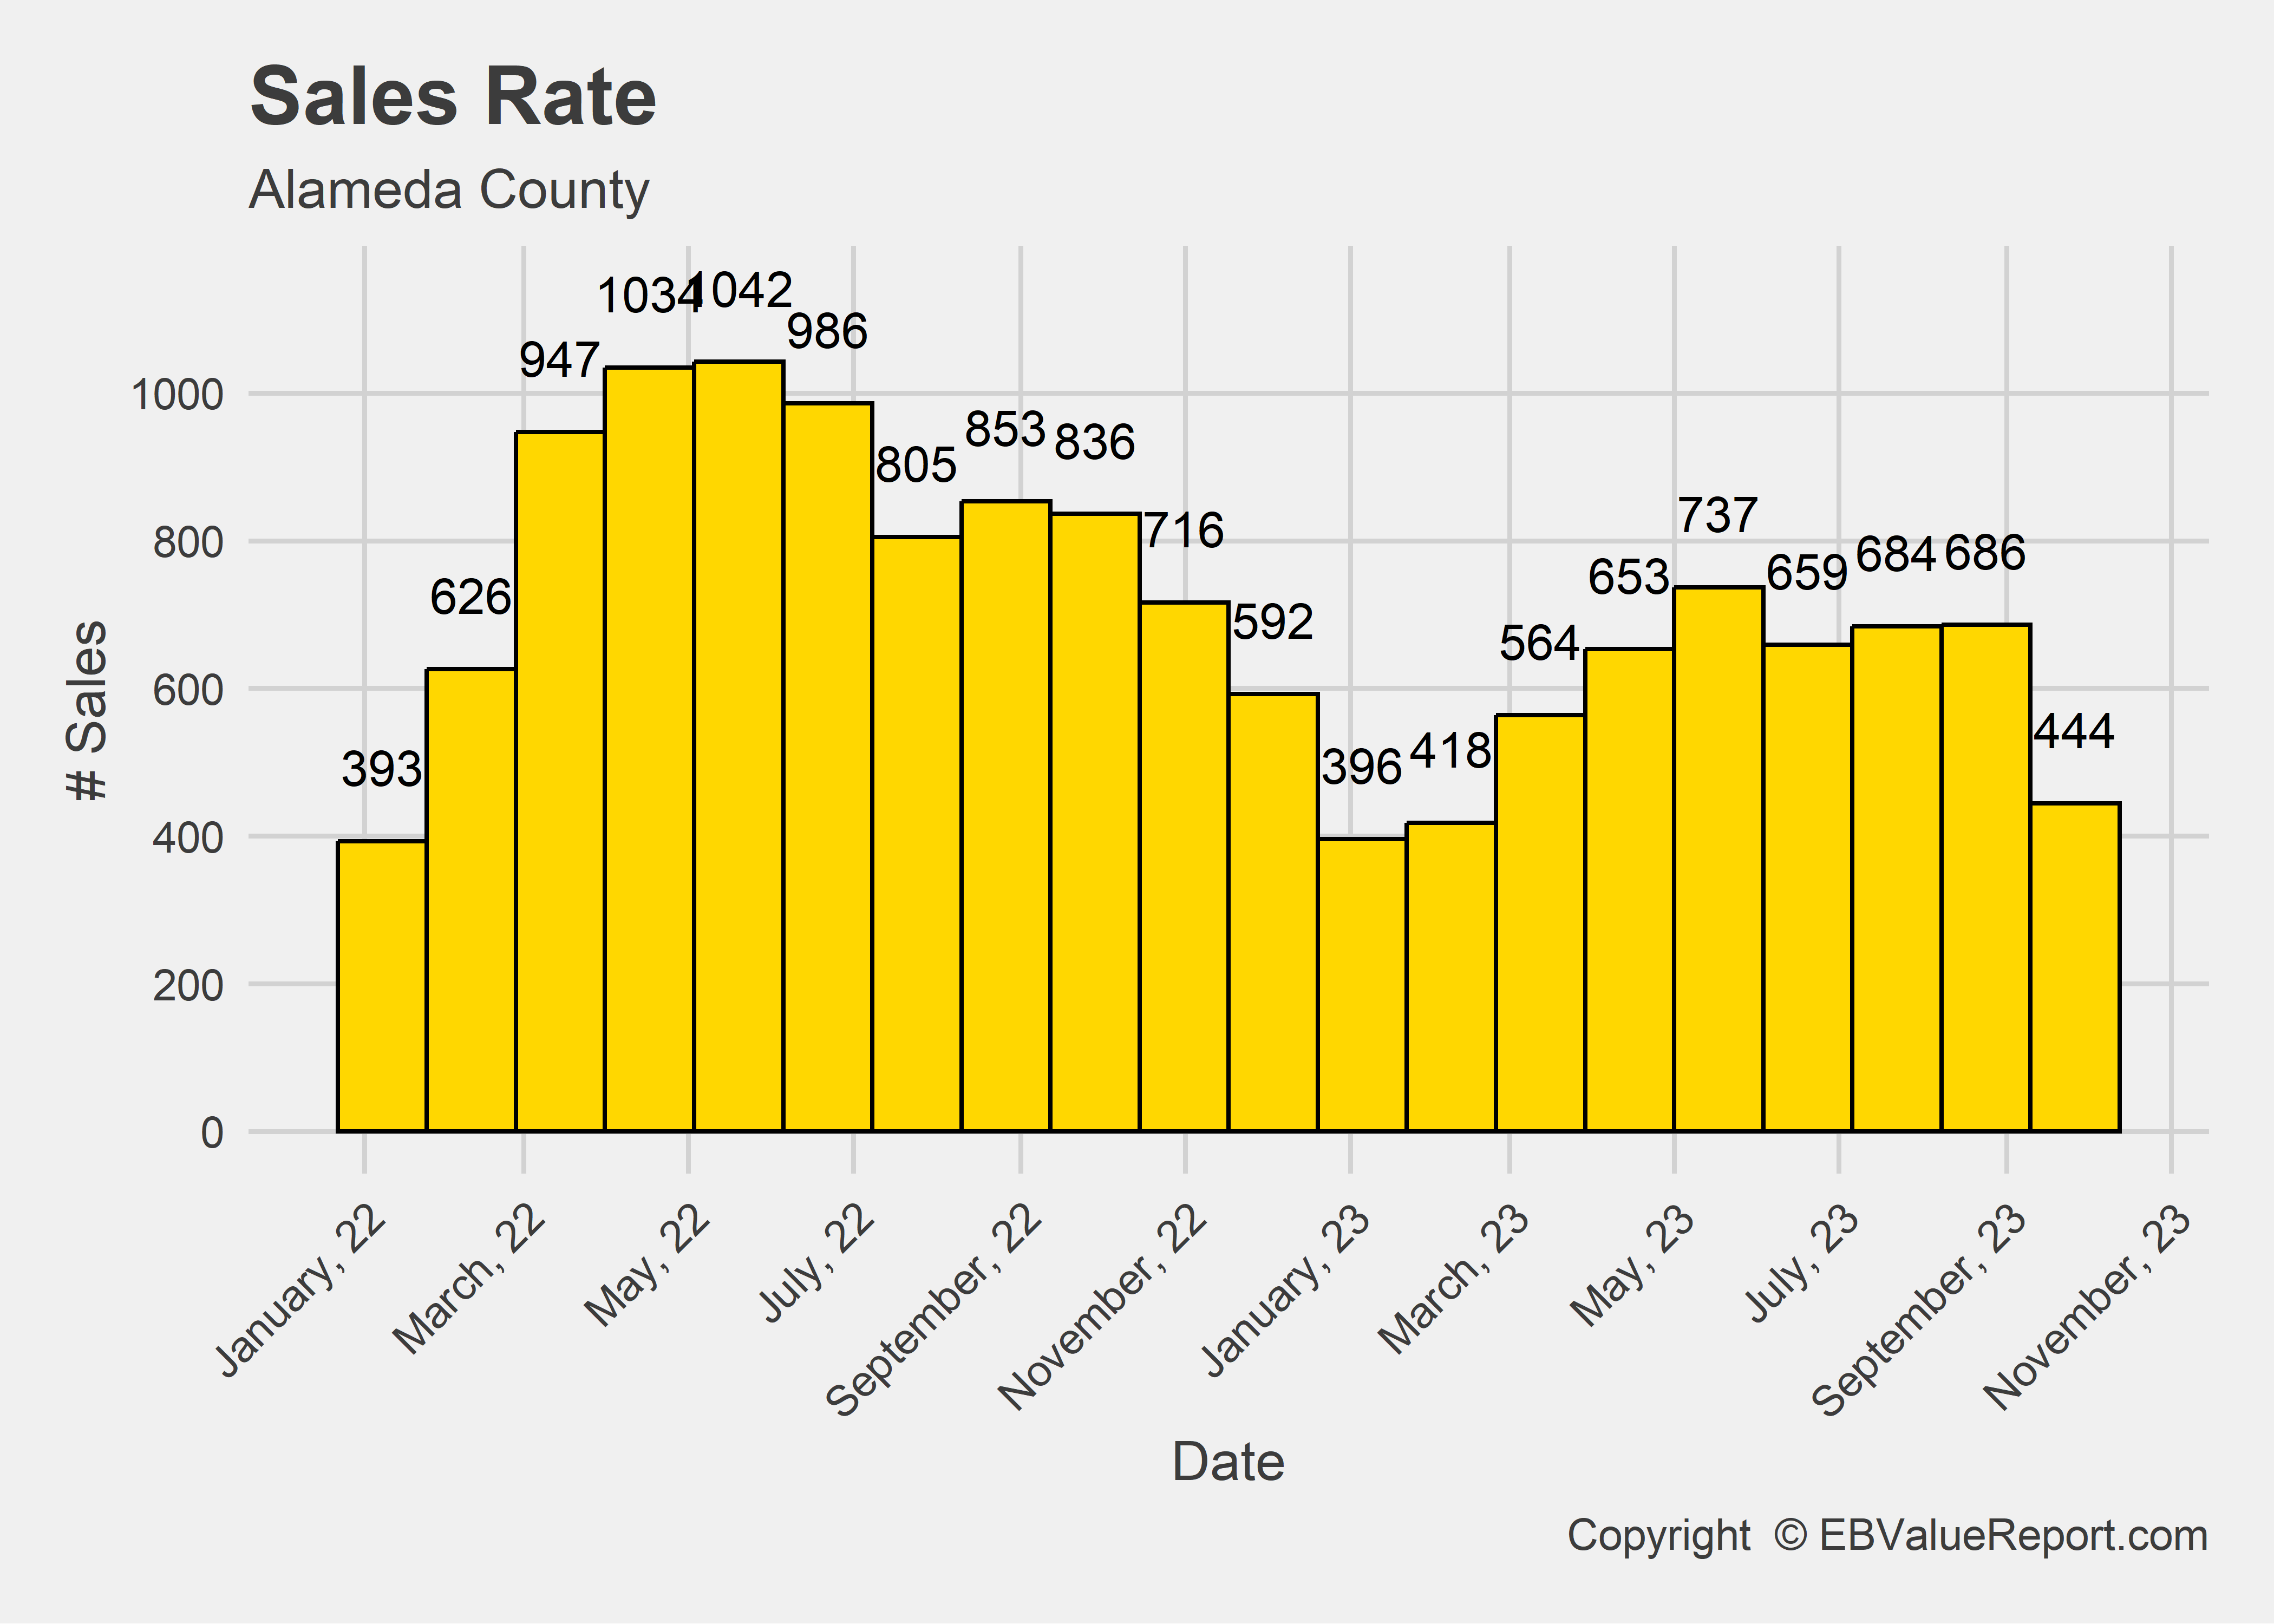
| Number of Sales | 655 | 615 | -6.1% |
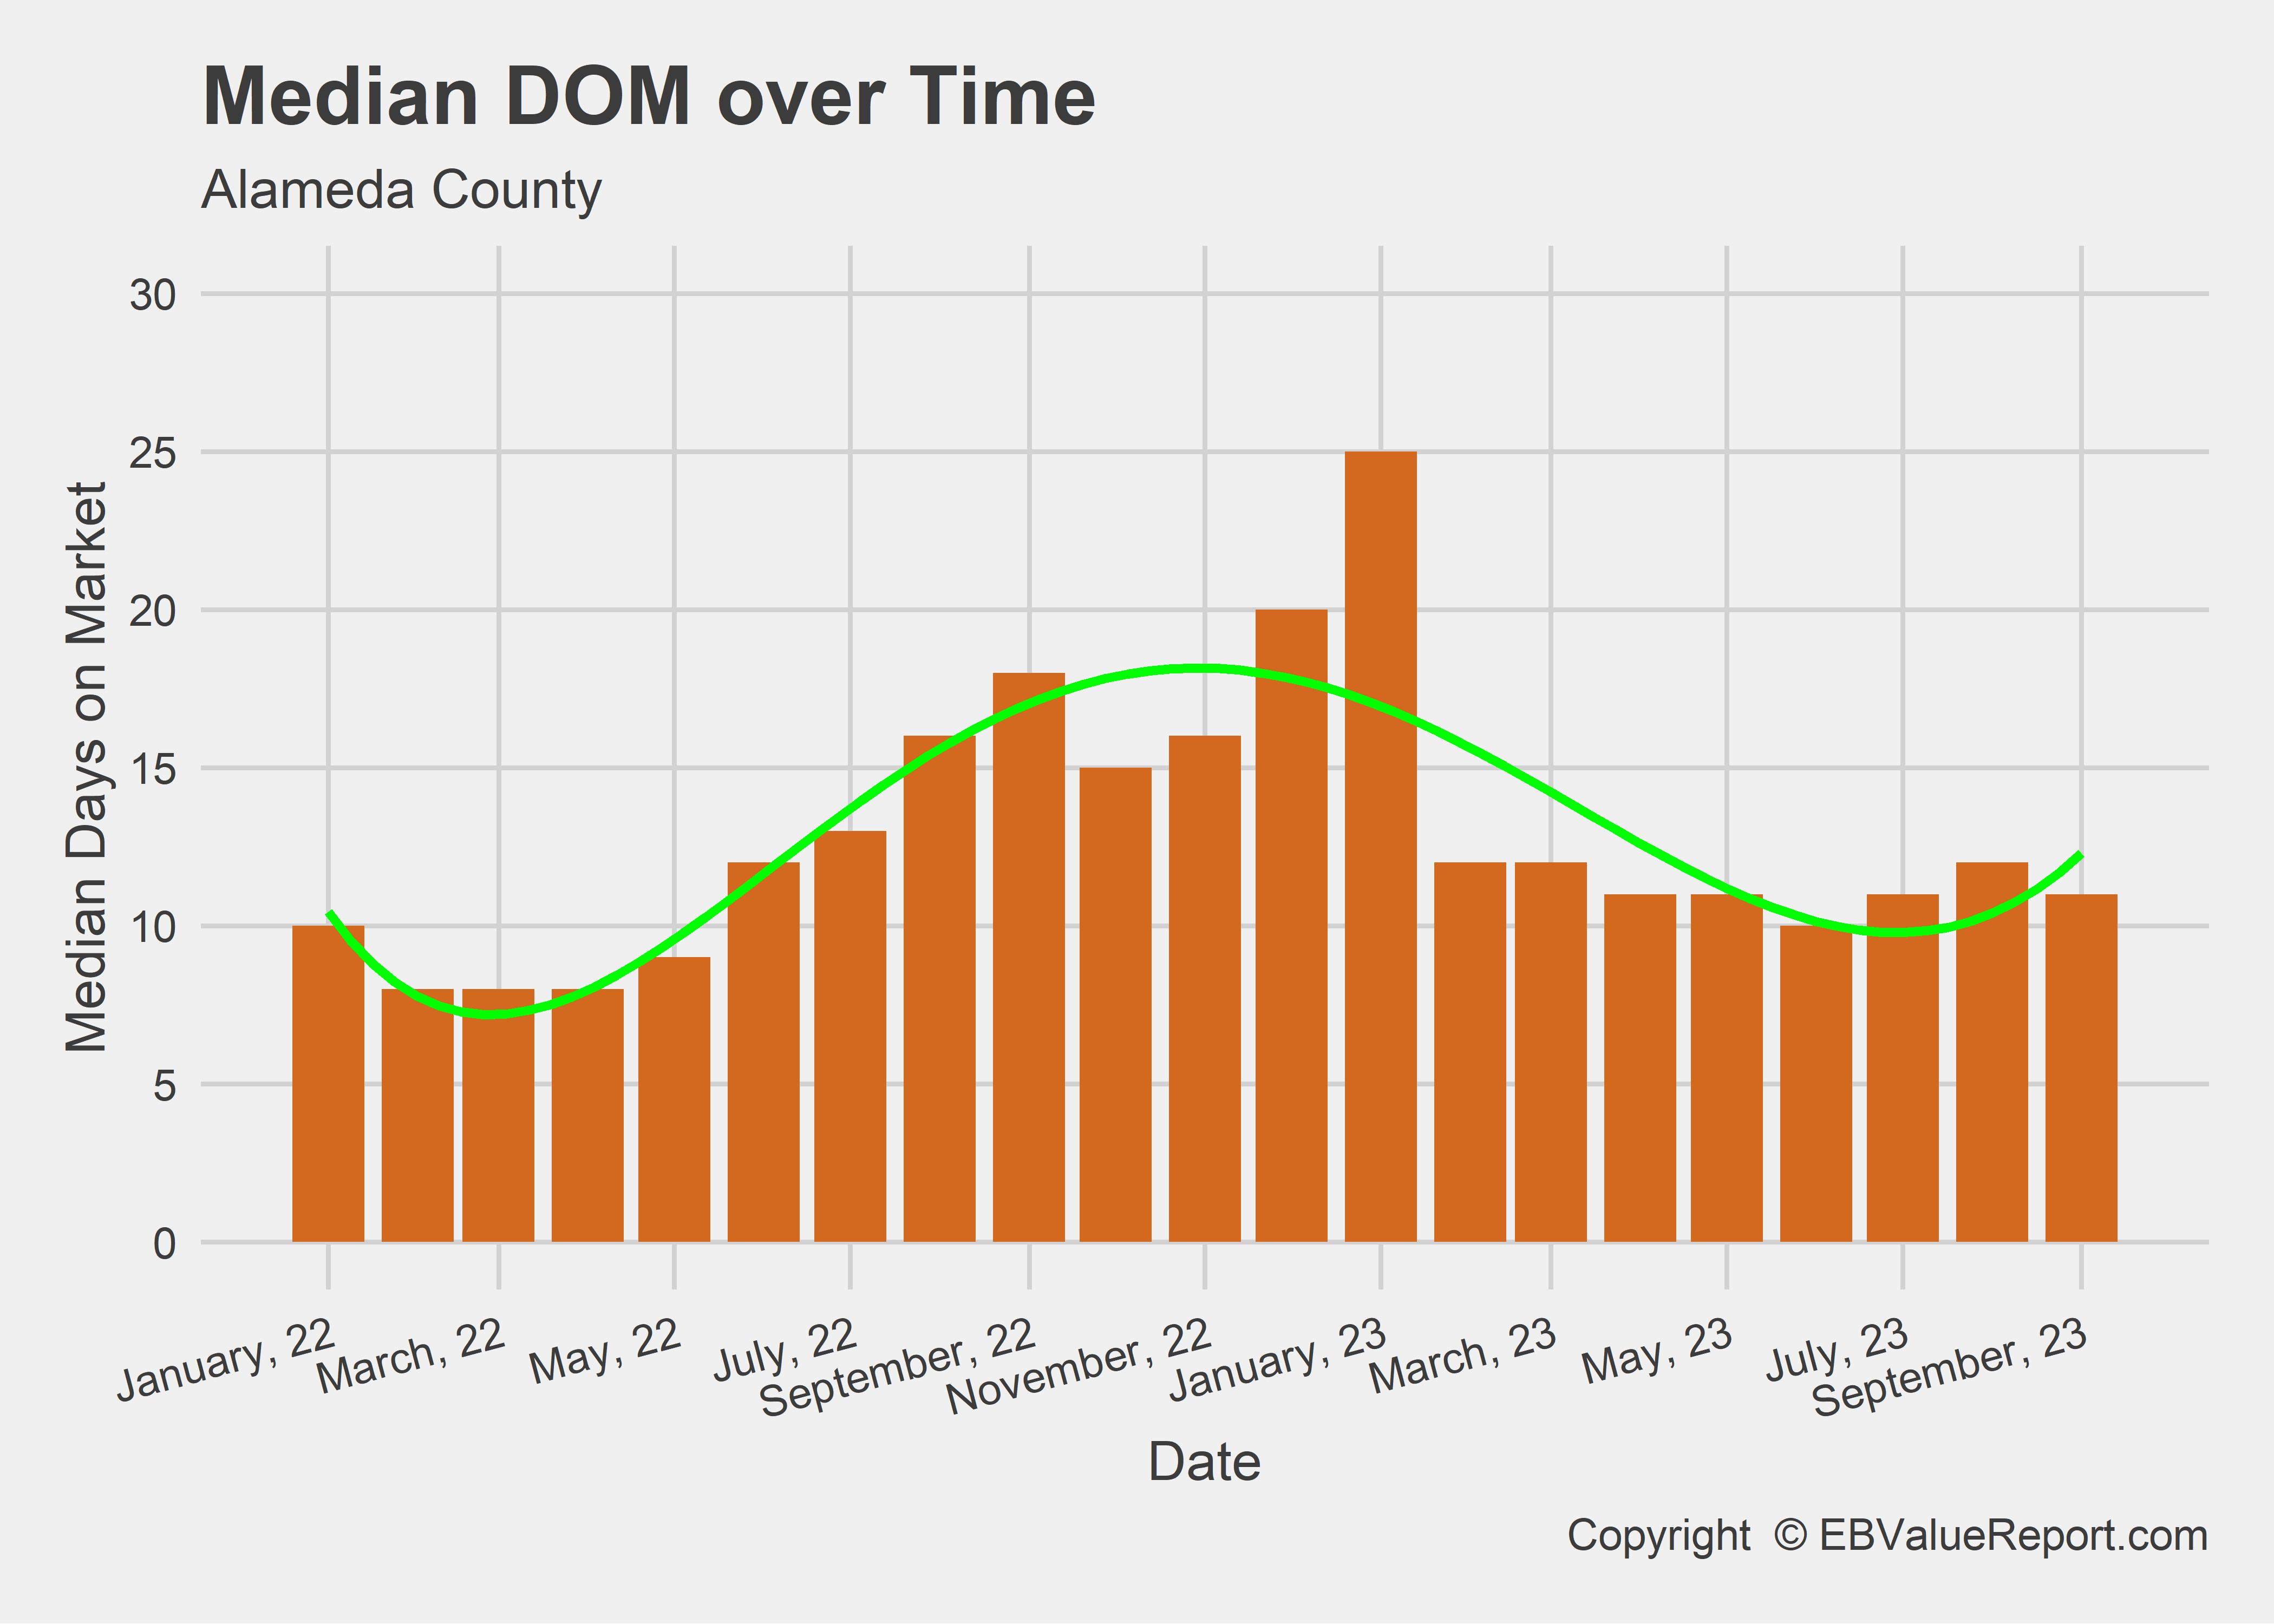
| Median DOM | 12 | 11 | -8.3% |
| Copyright © EBValueReport.com | |||
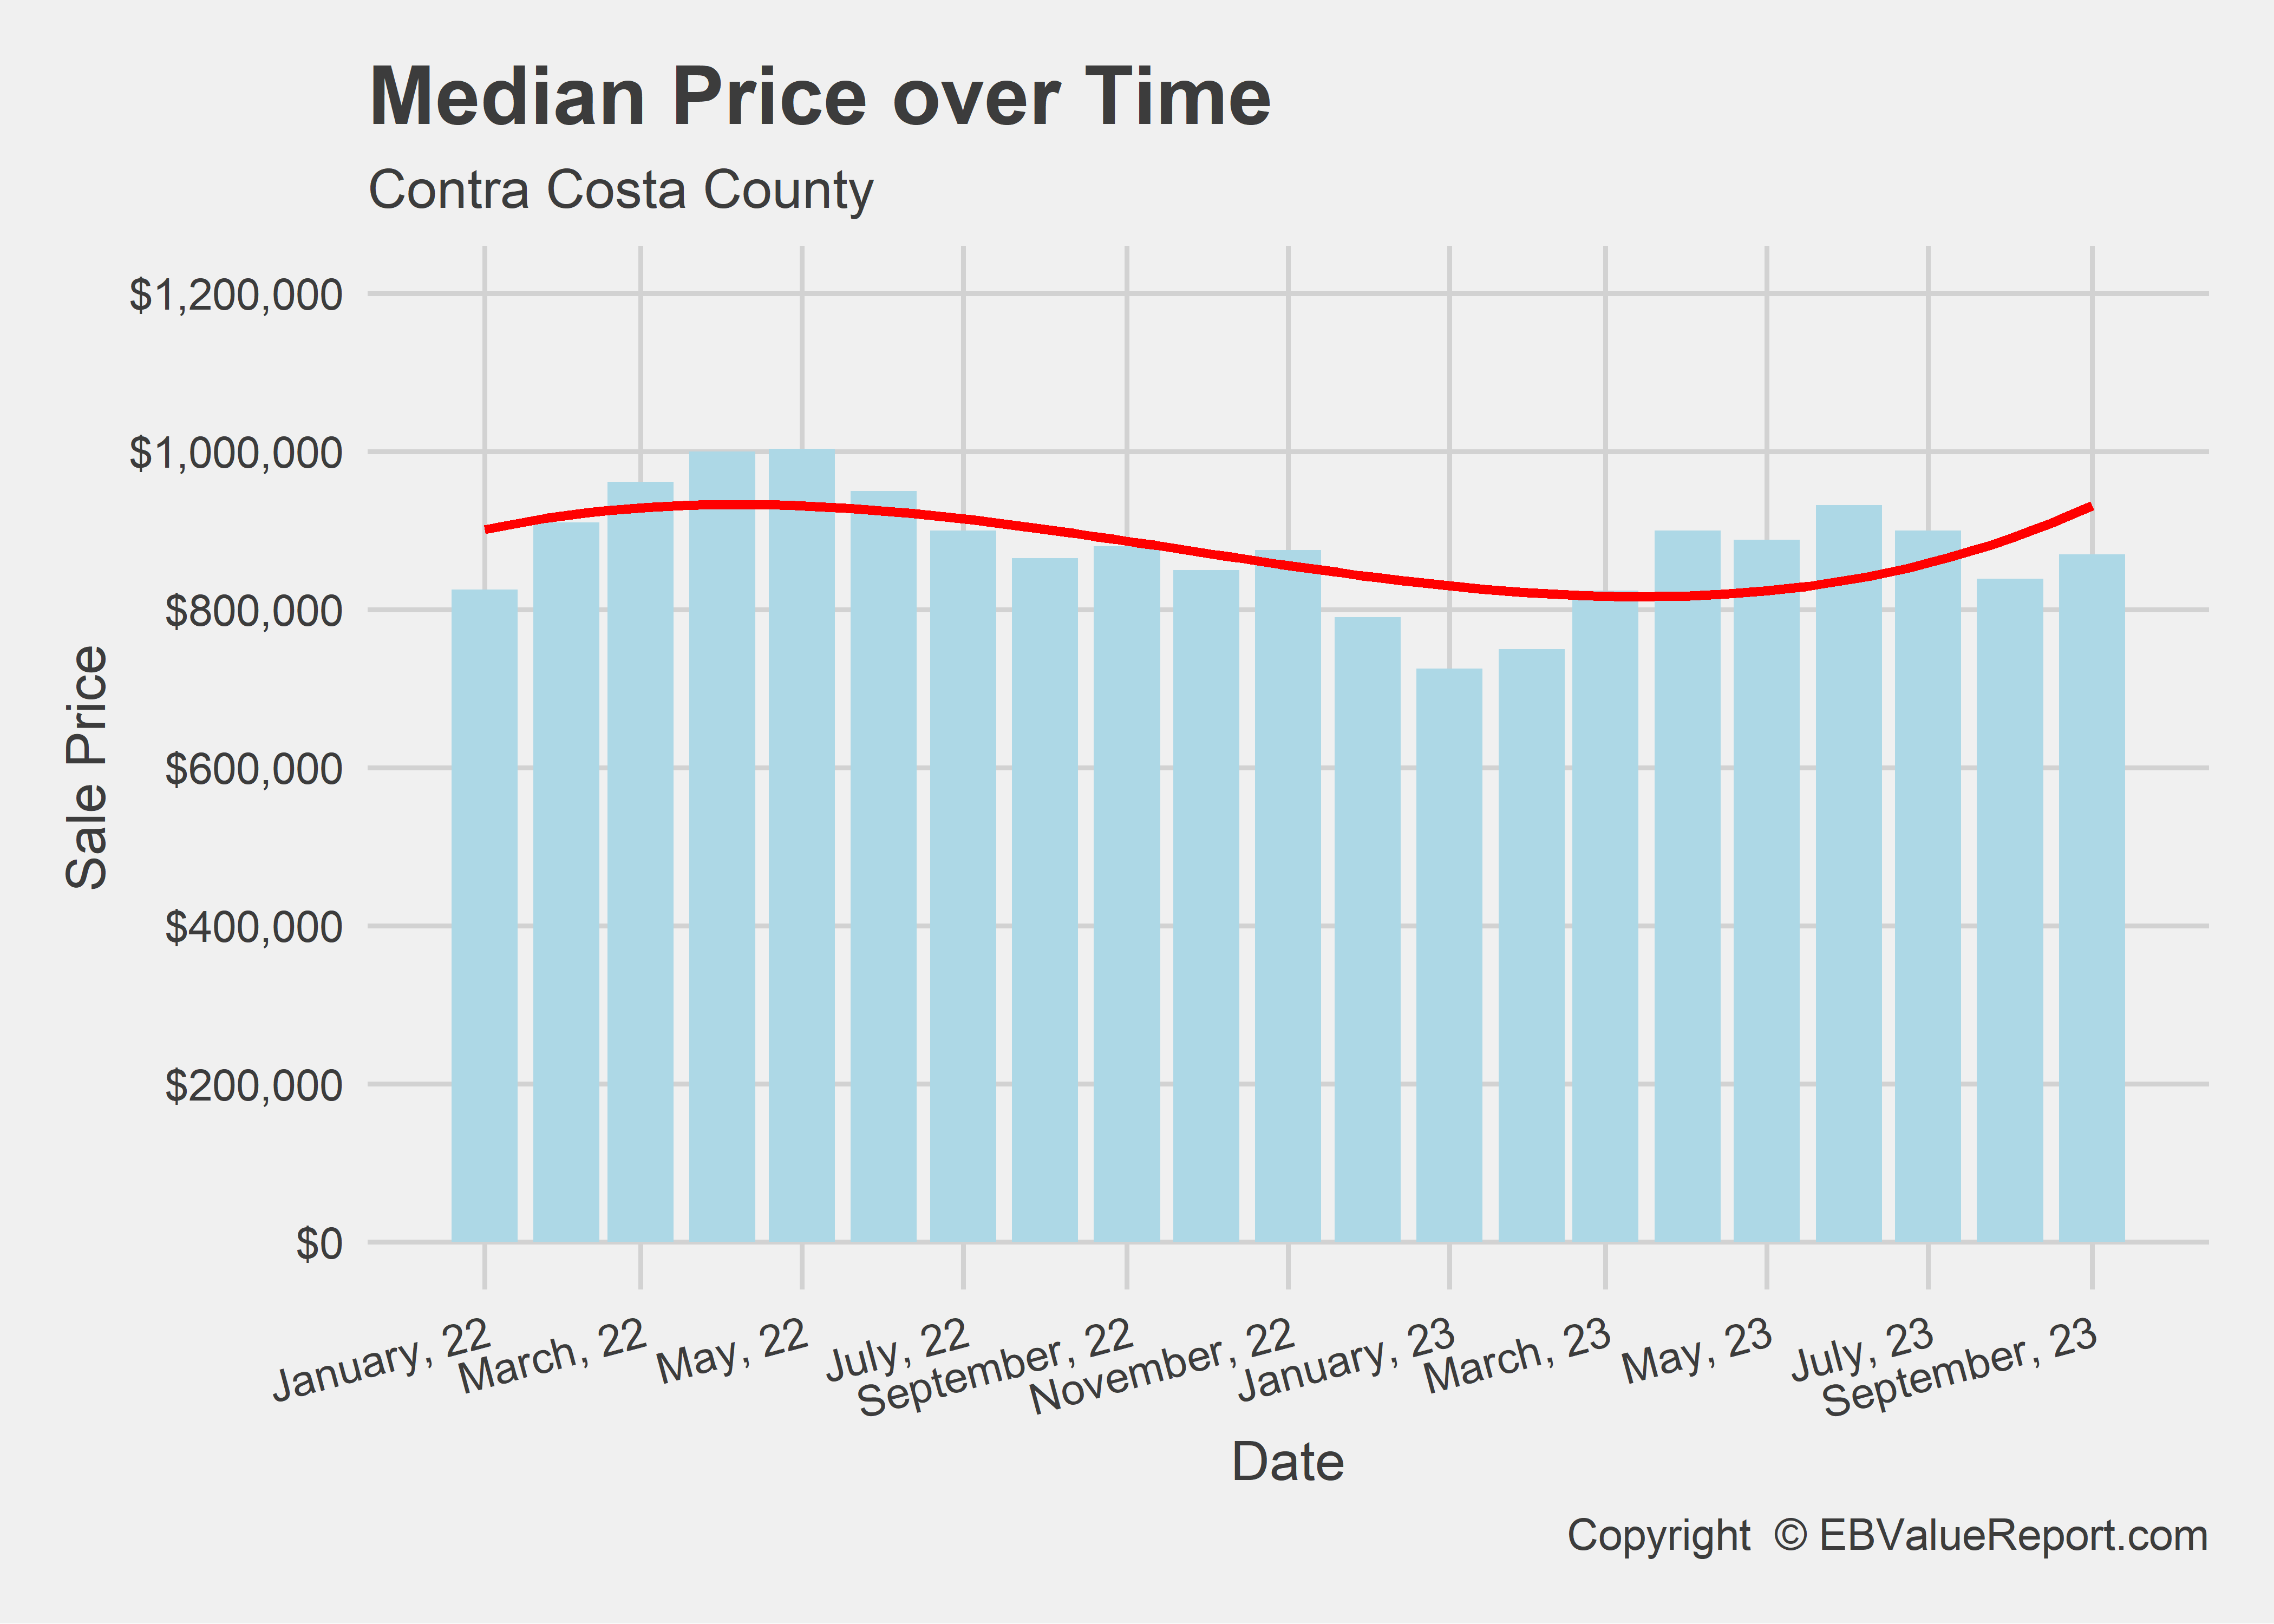
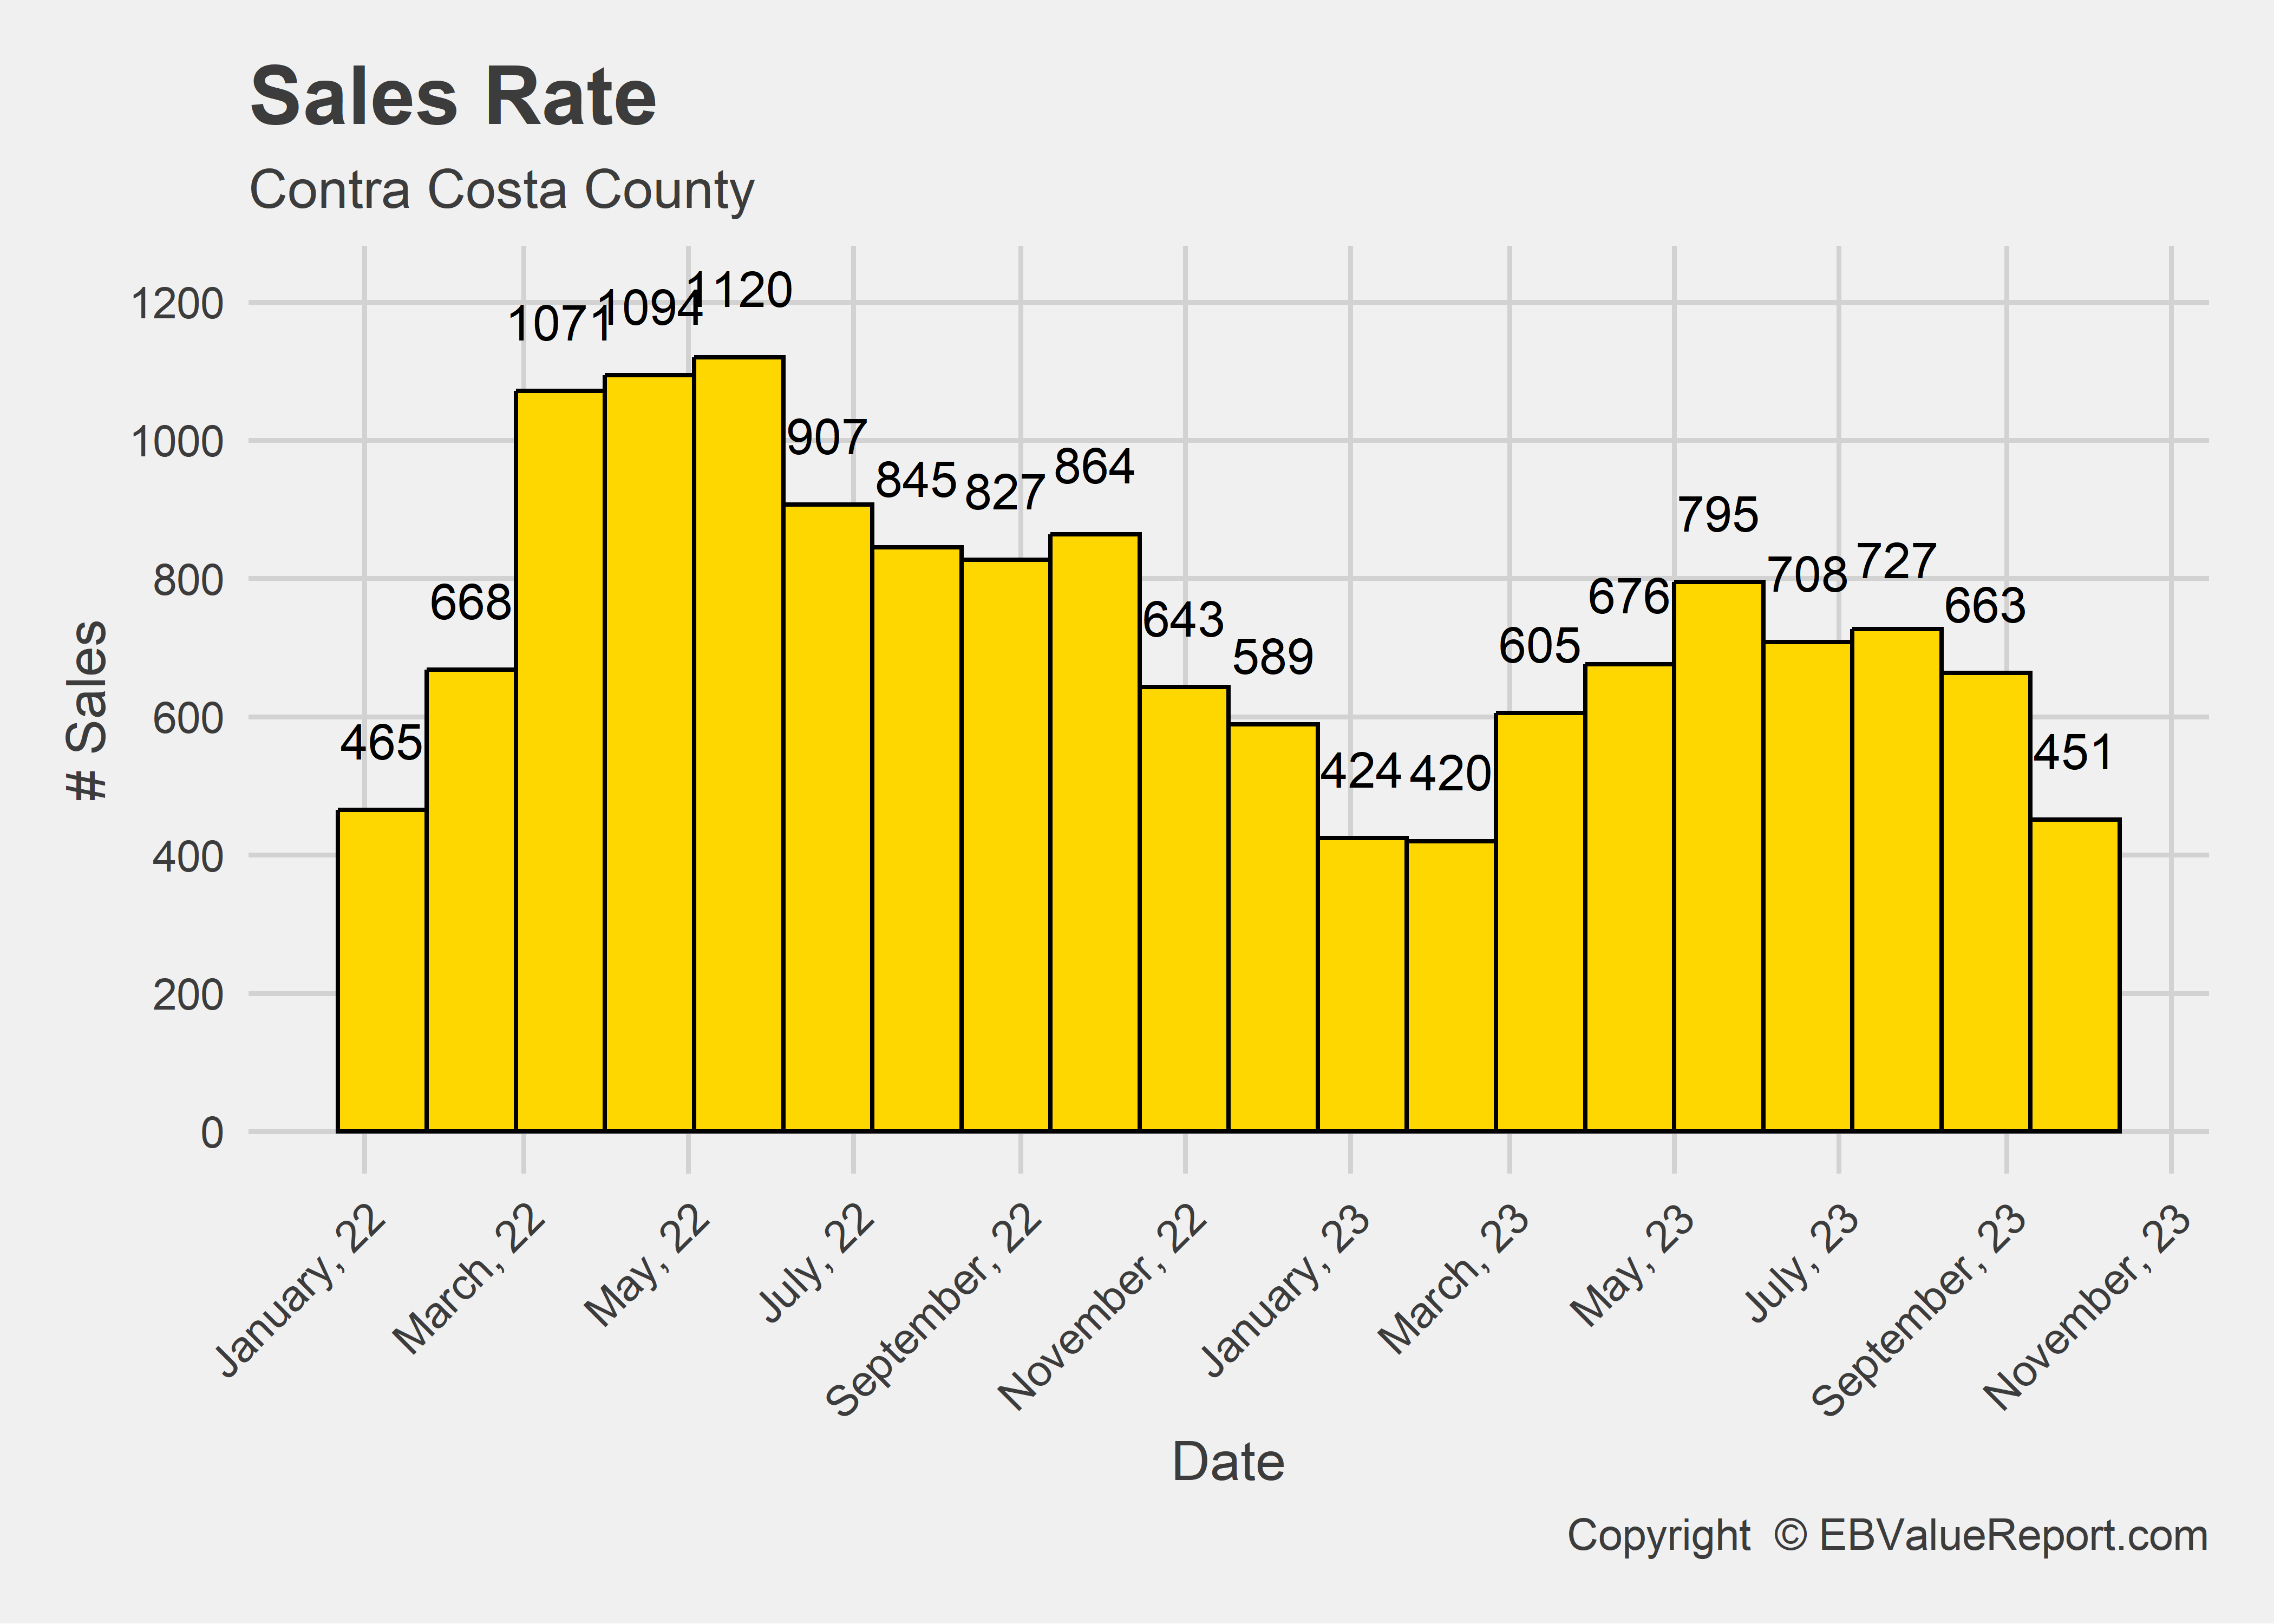
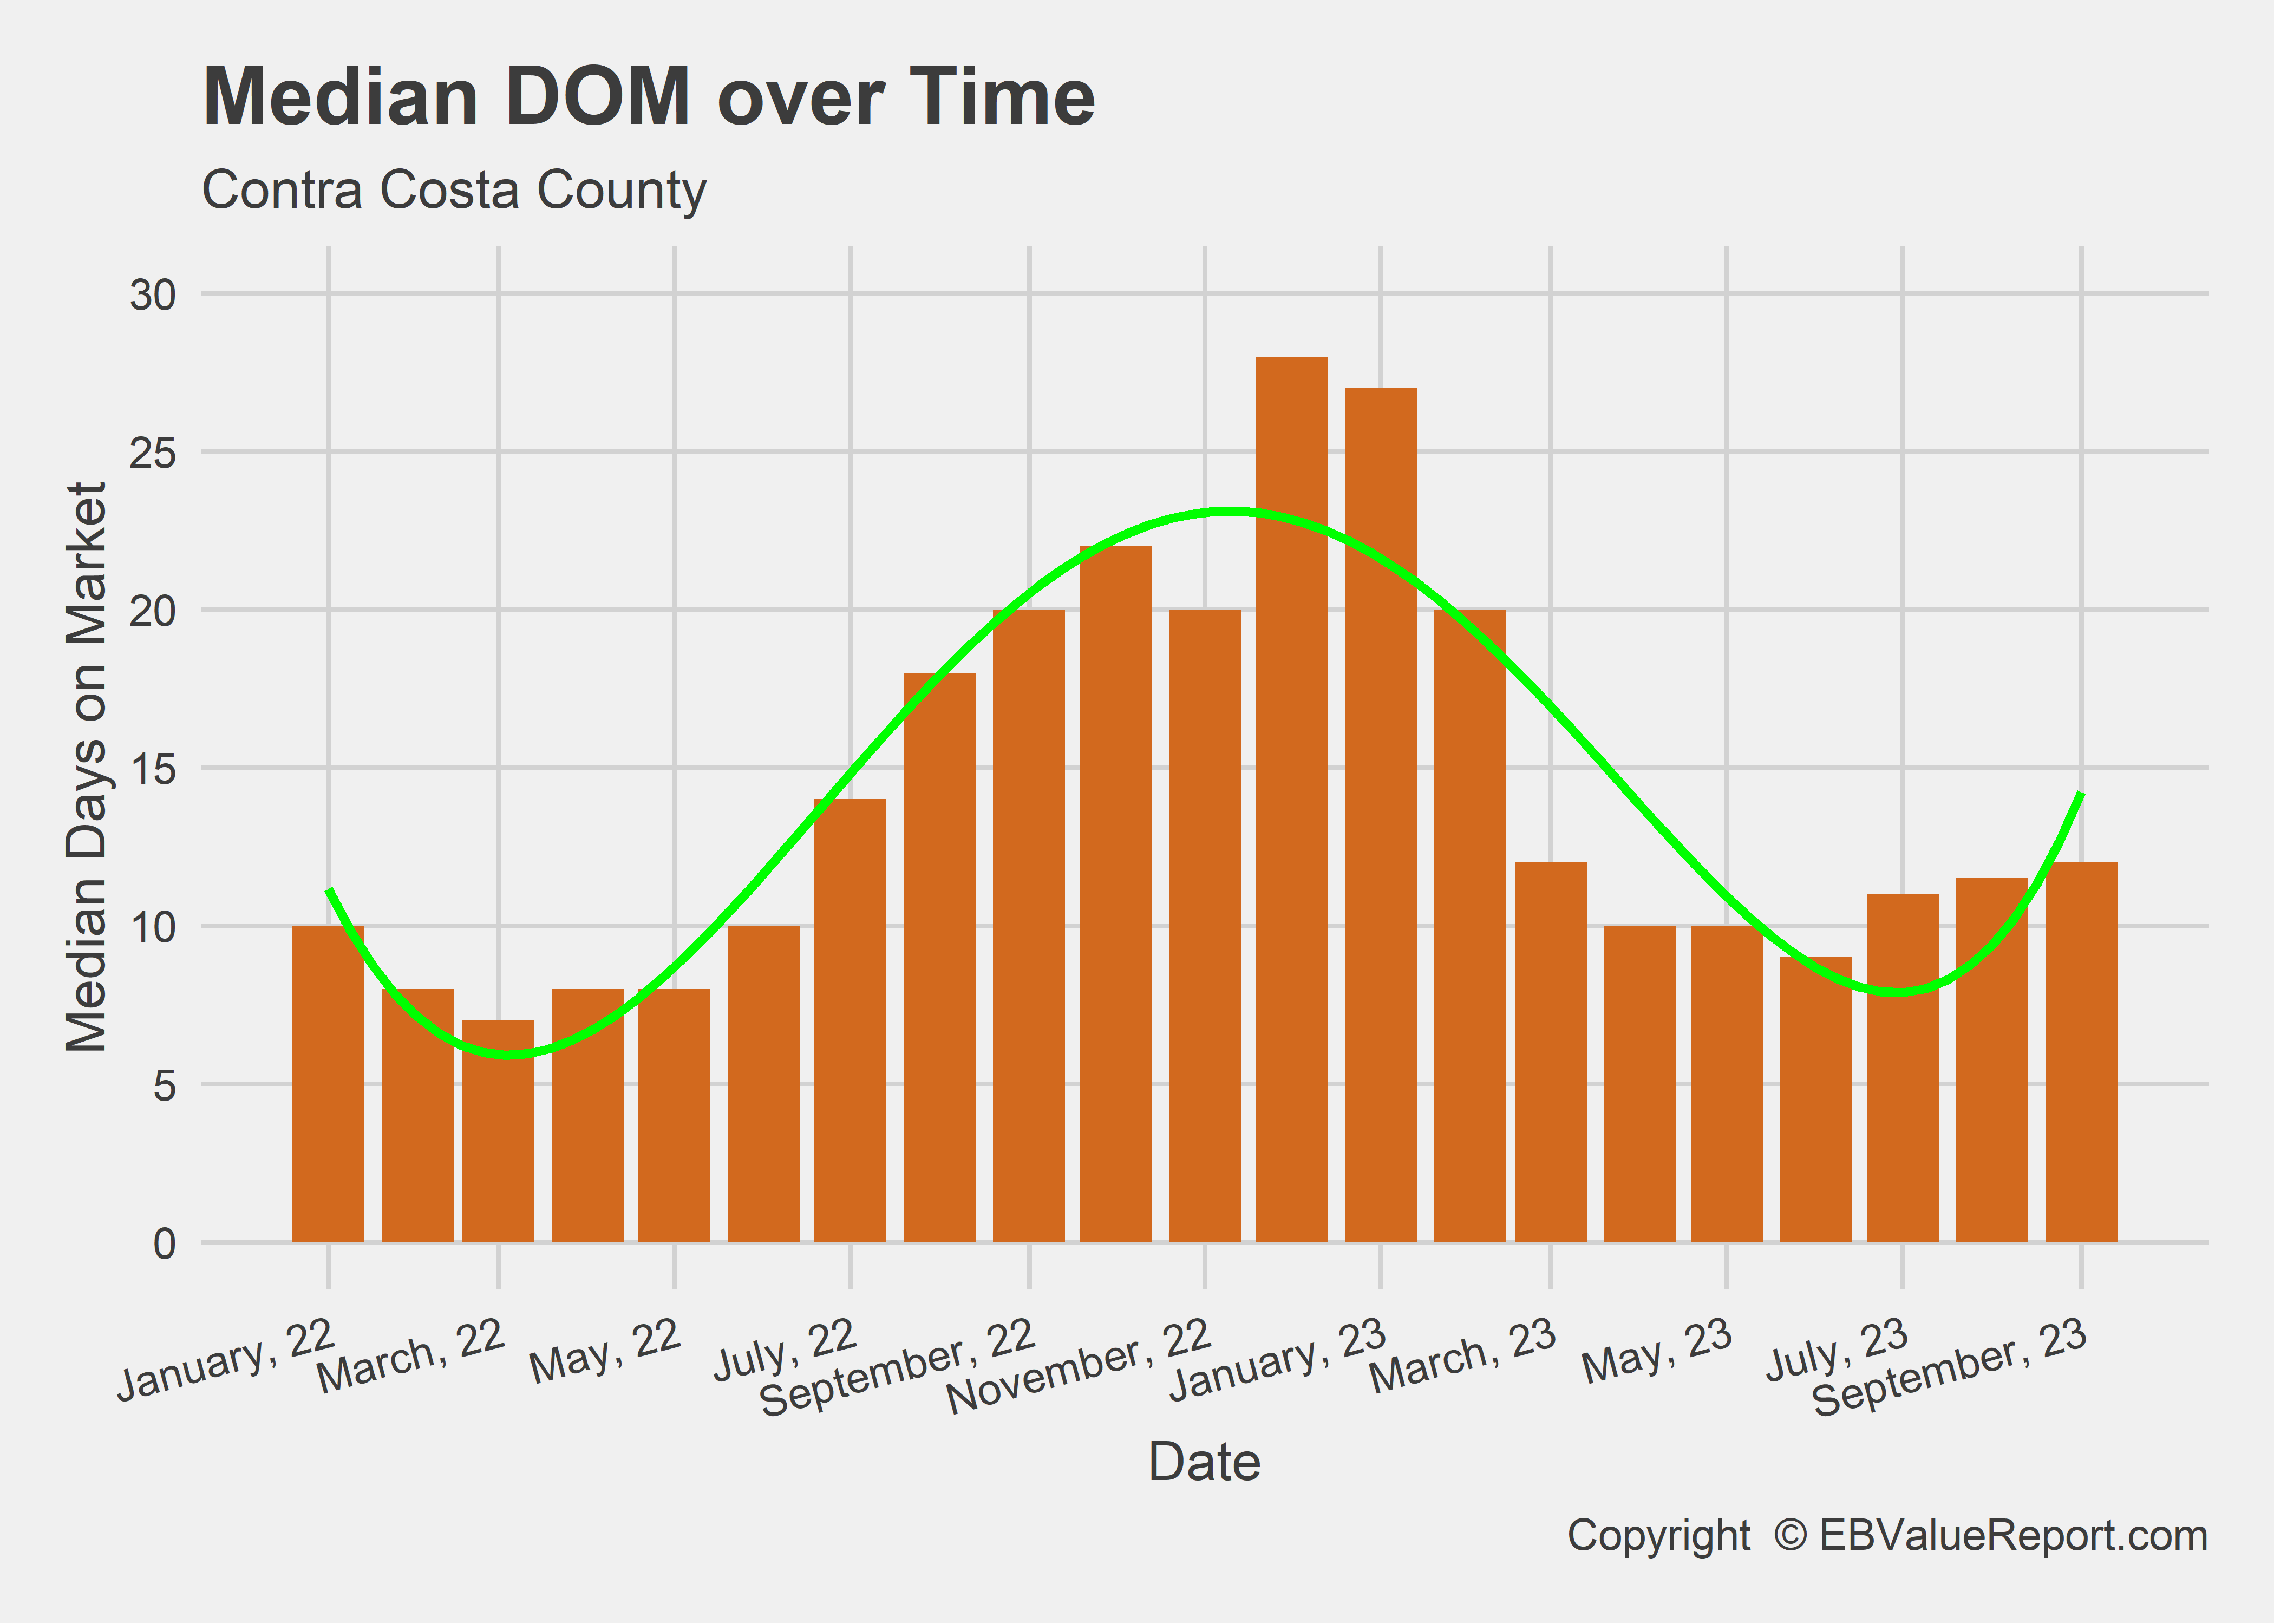
Contra Costa Trends
| Contra Costa County Housing Trends | |||
|---|---|---|---|
| Detached Single Family Homes | |||
| Aug 2023 | Sep 2023 | % Change | |
| Median Price | 839000 | 870000 | 3.7% |
| Average Price per SF | 553 | 562 | 1.6% |
| Number of Sales | 668 | 586 | -12.3% |
| Median DOM | 12 | 12 | 0.0% |
| Copyright © EBValueReport.com | |||
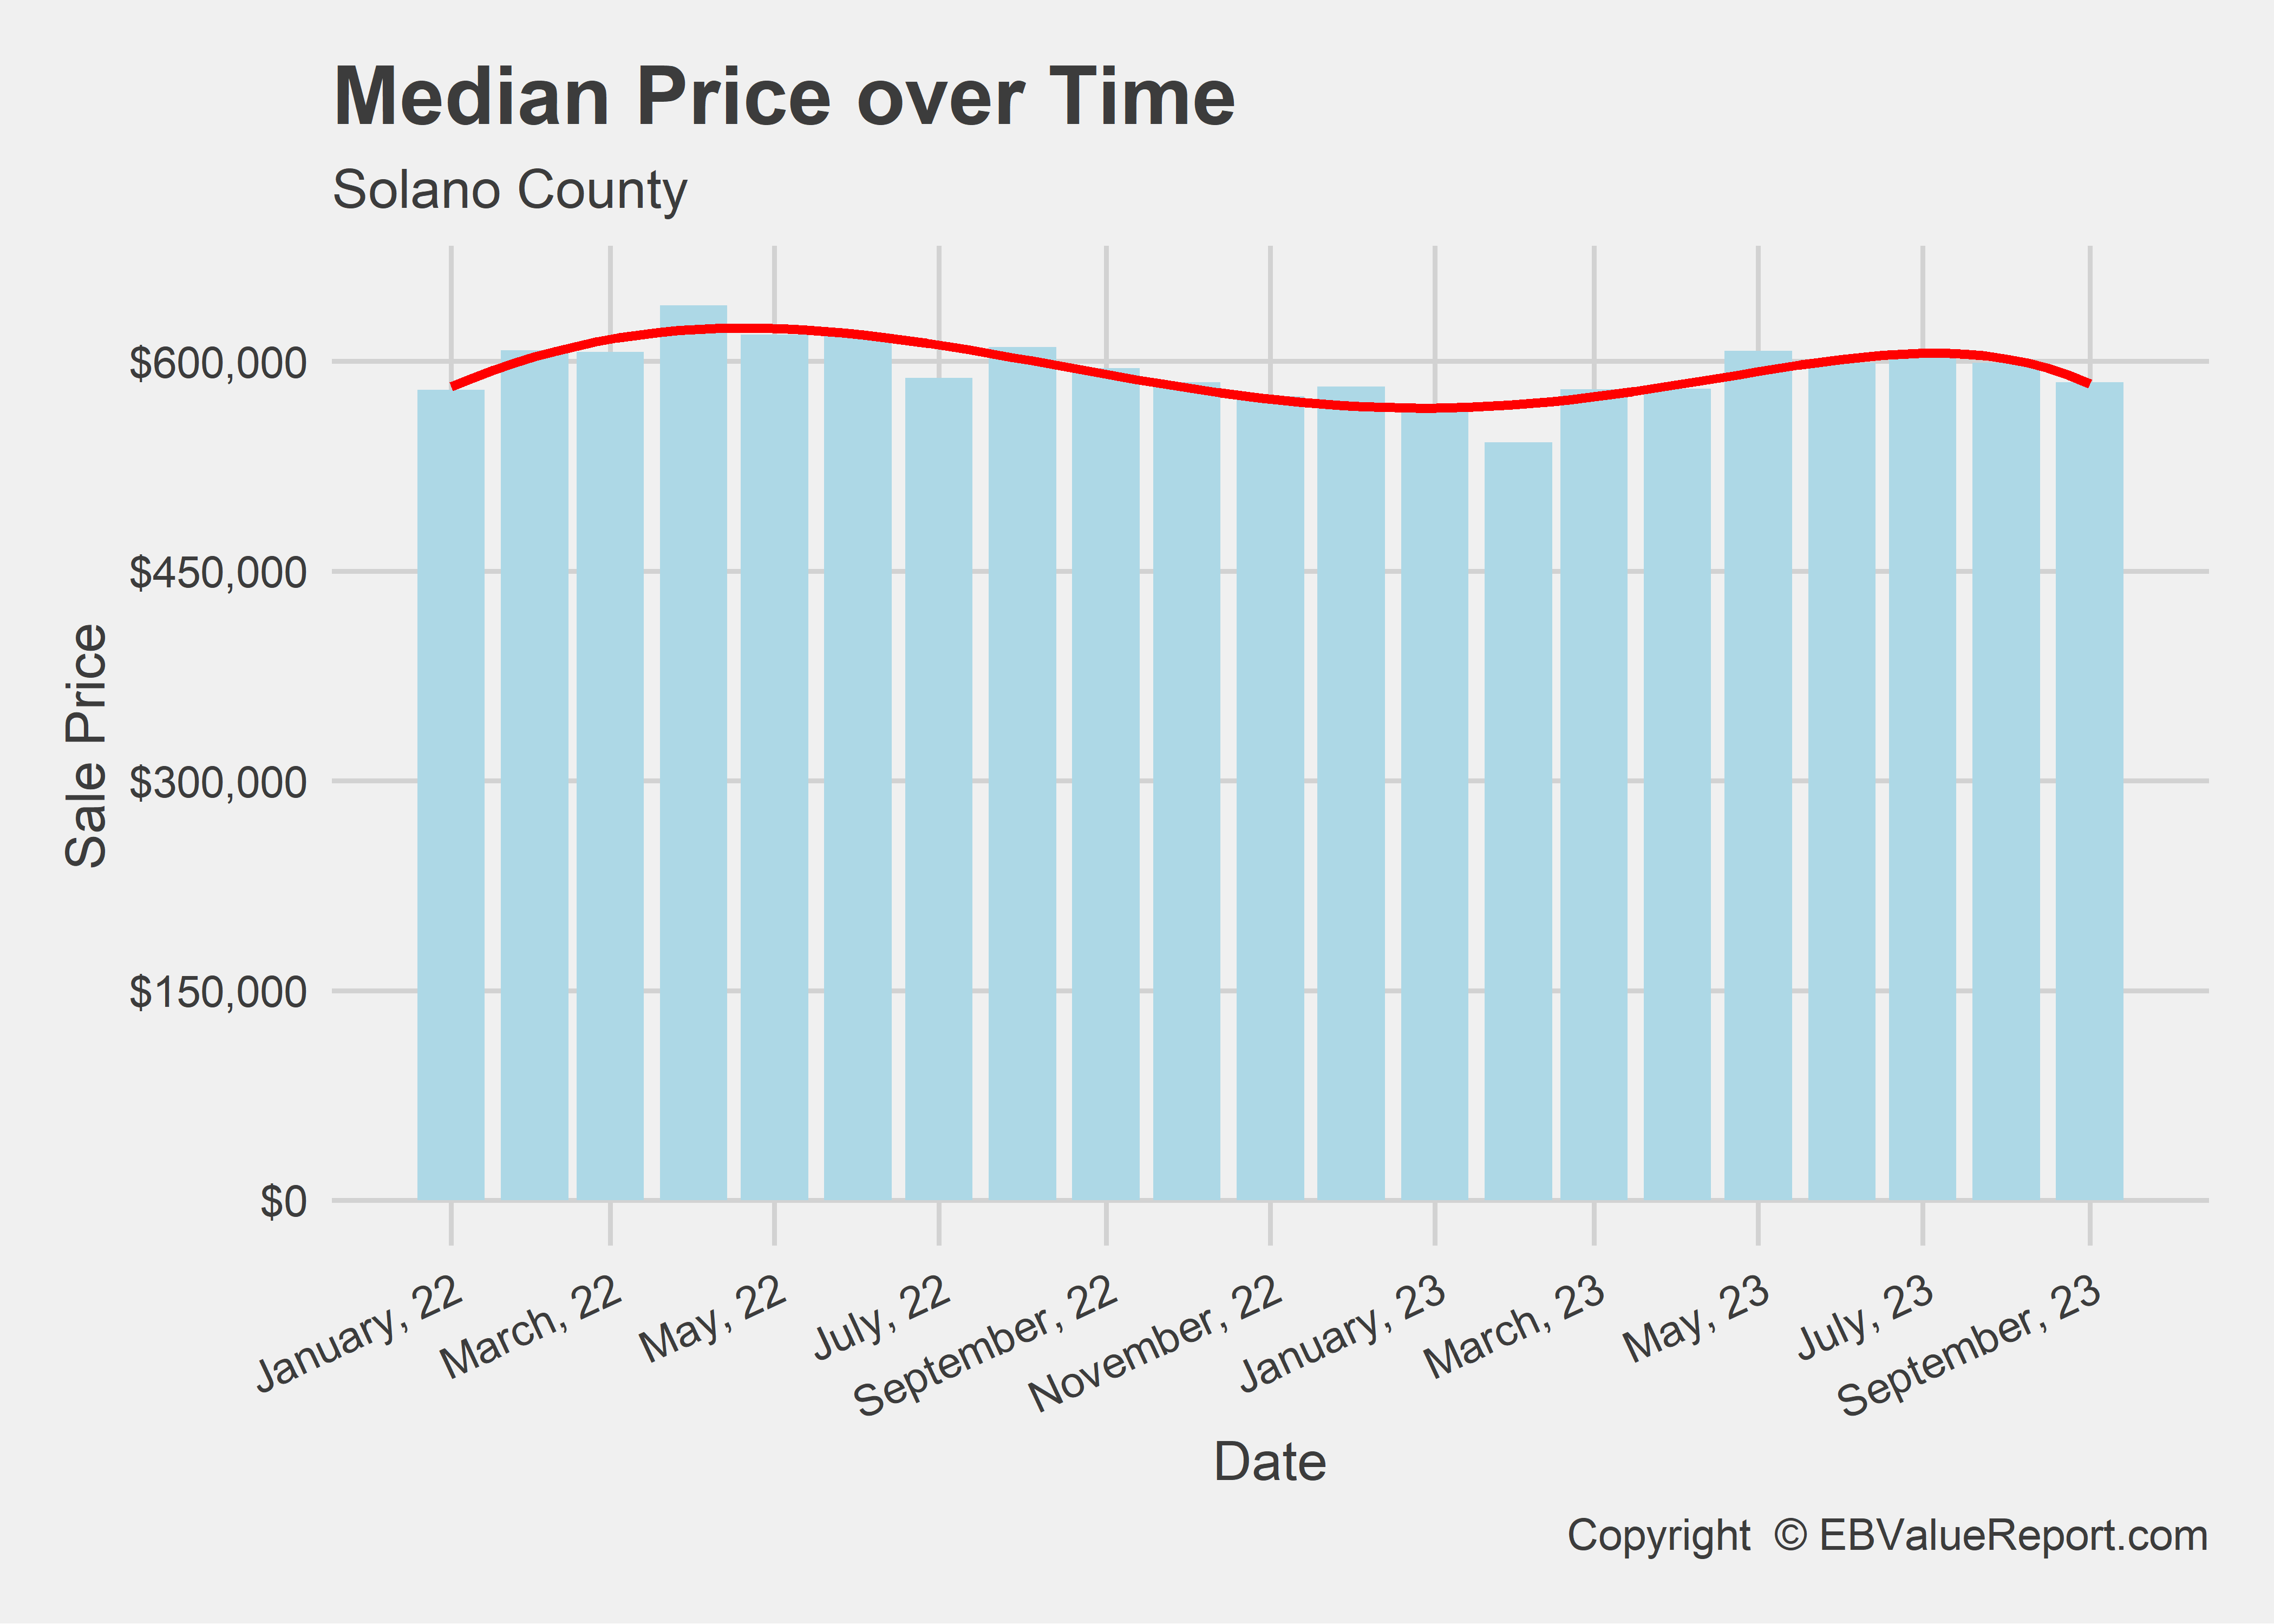
Solano Trends
| Solano County Housing Trends | |||
|---|---|---|---|
| Detached Single Family Homes | |||
| Aug 2023 | Sep 2023 | % Change | |
| Median Price | 599000 | 585000 | -2.3% |
| Average Price per SF | 364 | 352 | -3.3% |
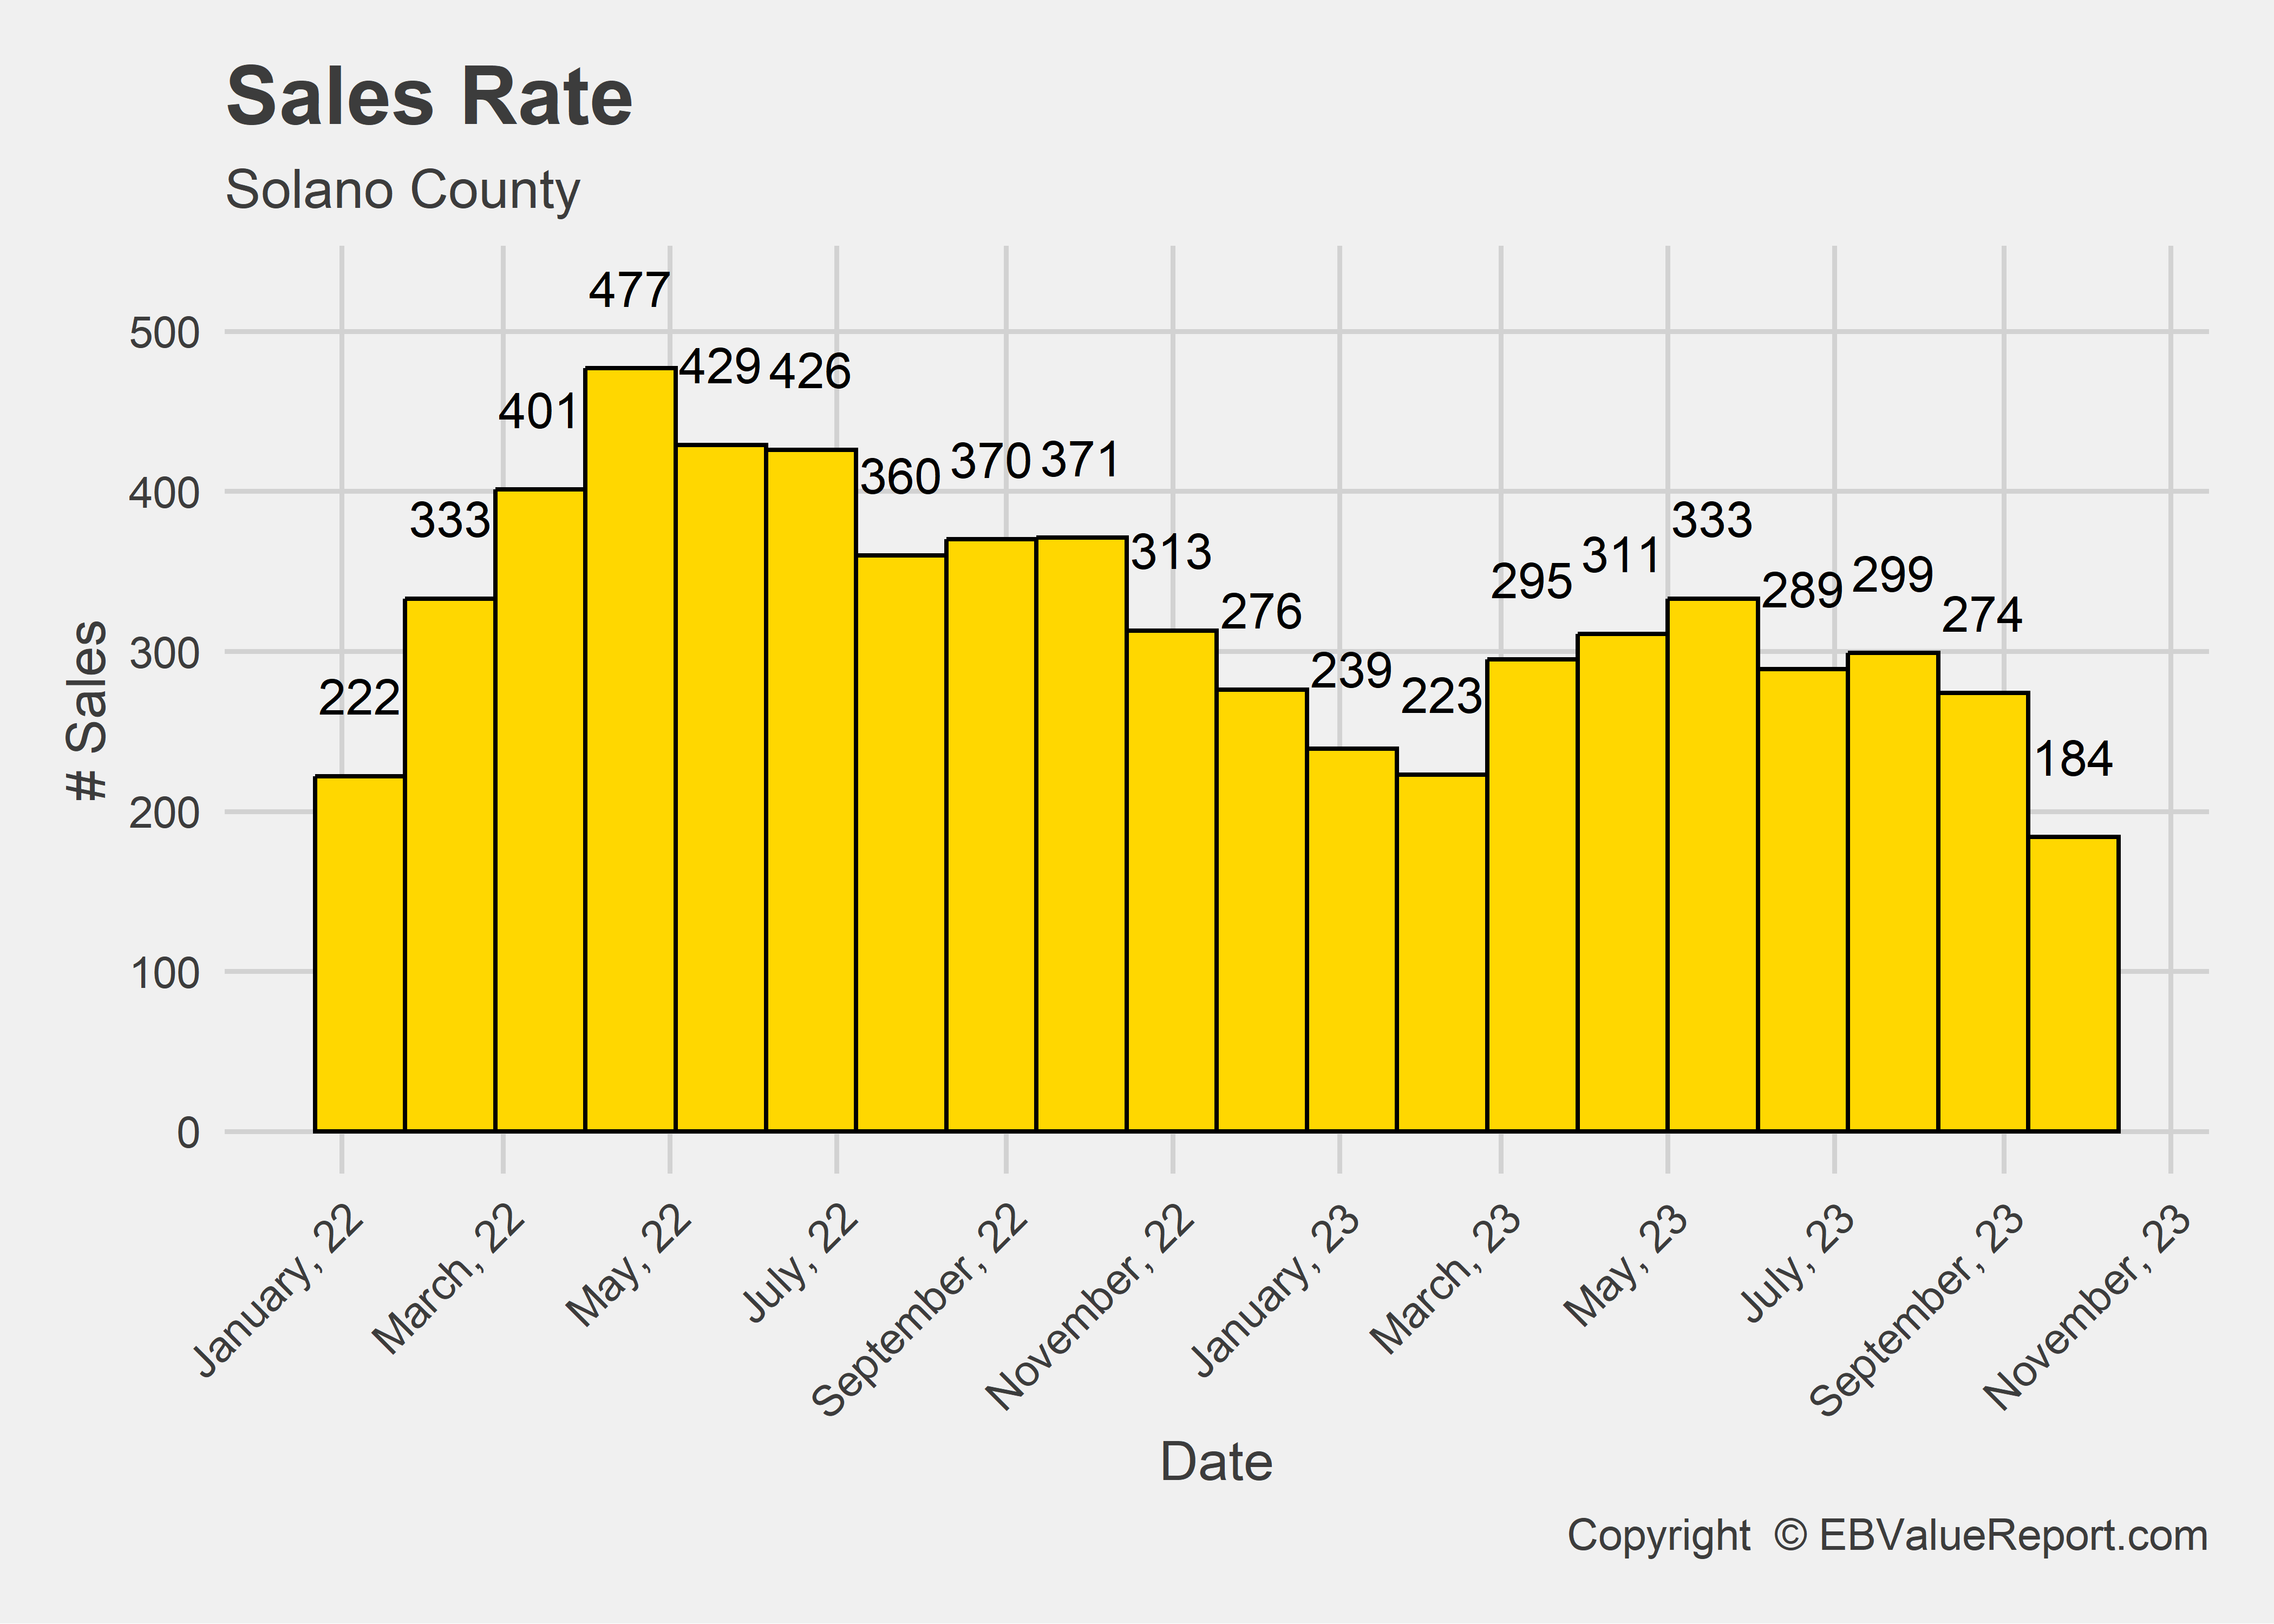
| Number of Sales | 278 | 232 | -16.5% |
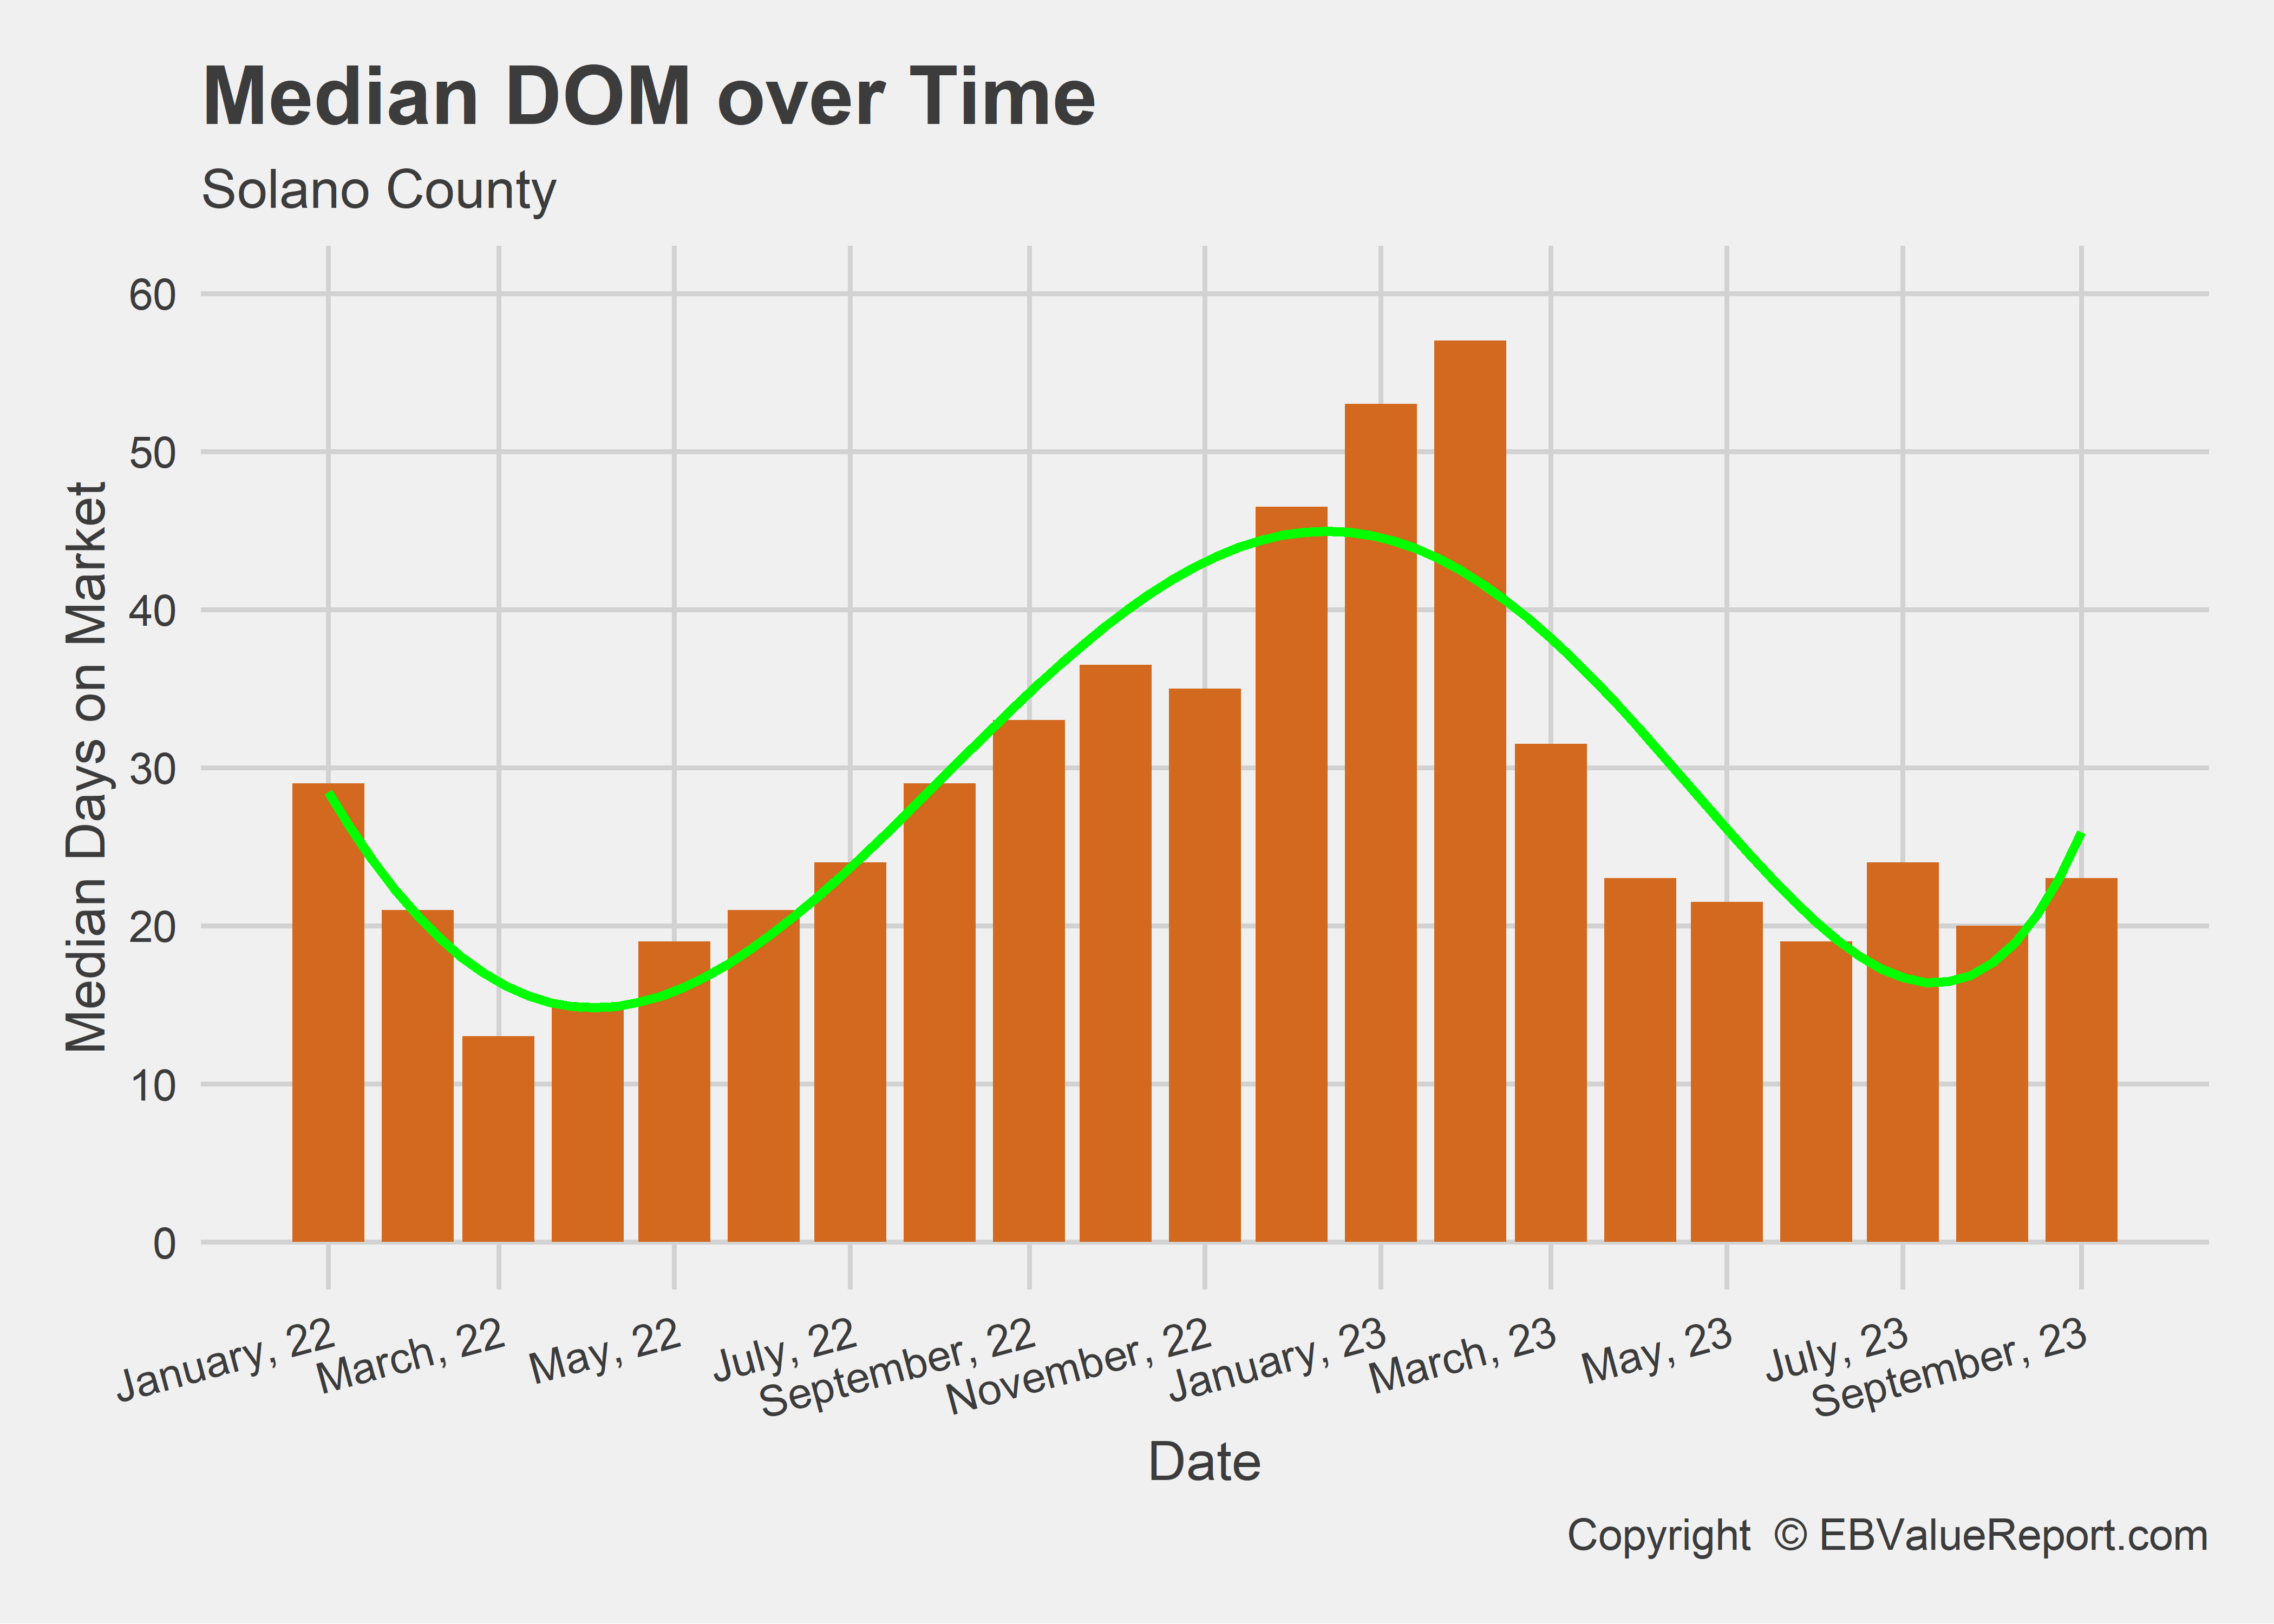
| Median DOM | 20 | 23 | 15.0% |
| Copyright © EBValueReport.com | |||
Need a Referral?
This is my list of local people I trust with my business needs:
Loan Officer: Brian Regg - CMG Home Loans
Upholstery/Window Treatment Cleaning: Bobby Carrillo- Bayview Onsite Drapery Cleaning
Construction: Mark Fawcett- Precision Building and Design
Commercial Broker (Sales and Leasing): Peter Maclennan - Maclennan Investment Group
Services for Agents
Pre-Listing Appraisals
With today’s market, every listing is precious. Don’t go into a sale blind, call us for a pre-listing appraisal today and say GOODBYE to the real estate grind.
Measurement Services
The county says “this” and the owner says “that.” You don’t want to get to the end of the sales process only to discover the size is quite different. For a nominal fee, any new listing can have an “Appraiser-certified” statement of Square footage [SqFt] complete with a floorplan. Give yourself and your clients peace of mind with our reliable and accurate measurement services.
Divorce/Estate Appraisals
If you have client that needs appraisal work for estate, taxation or ligation purposes, we can help! Our firm services the East Bay Area, but we have a wide network of referrals and resources available for your clients.
.png)

